Message Center overview
By default, the Message Center is minimized to a message tray at the bottom left of the console. The message tray notifies you of how many messages were received, during which time-period they were received, and the highest severity of all the messages (indicated by a color-coded callout icon). It is always global in scope, showing information for all servers and tasks.
The Message Center will not show log messages reported by Compose servers and tasks. However, messages reported by Enterprise Manager such as when monitoring has started /stopped for a Compose server or when a server has been deleted, will appear.
In the message tray, the message severity icon indicates the highest severity of the received messages. For example, if 11 messages were received but only one of them was an error message, the severity icon is red. Other callout colors are orange for warning messages and blue for informational messages.
Message Tray Example

To open or close the Message Center:
- Click the diagonal arrows to the right of the message summary.
To maximize the Message Center:
- When the Message Center is half-way open, click the Maximize icon in the top right corner.
To reduce the size of the Message Center:
- When the Message Center is fully open, click the Restore Down icon to the right of the message summary.
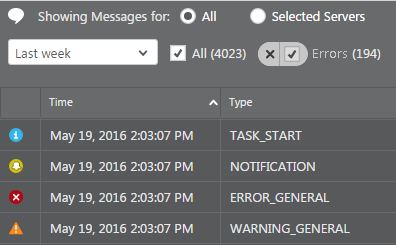
The following types of messages can be displayed: Info, Notification, Warning and Error. The actual message types that Qlik Enterprise Manager displays as well as the display time period depend on your Message Center preferences.
Each message type has its own icon, as shown below:

For each message, the following information is available:
- Severity Icon: Info, notification, warning or error
- Info: circular blue "i" icon
- Notification: circular yellow bell icon
- Warning: triangular orange exclamation mark icon
- Info: circular red "x" icon
- Time: When the event occurred
- Reported By: The display name of the Replicate server. For messages reported by Enterprise Manager, this field has a value of Qlik Enterprise Manager.
- Server: The name of the server in Enterprise Manager
- Task: The task that generated the message
- Type: The event that generated the message, such as TASK_START
- Message: The actual message as issued by the Replicate Server or Enterprise Manager
-
Error Code: Shows the error code of task errors. You can set a task notification that will be sent whenever specific error codes are returned. For more information, see Setting a task notification.
Note that only error codes for tasks running on Replicate versions 6.2 or later will be shown.
Not displayed by default:
- Table: The table name when the message is related to a particular table. Will appear after the Task column if added.
-
ID: A unique ID that serves as a reference number. You can copy the ID to the clipboard for easy reference, for example to paste it into an email when you need to refer to a specific message or to search for the message later. Will appear after the Error Code column if added.
