Monitoring Data Warehouse tasks
You can view general information on the progress of Compose Full Load or Change Processing operations in the Task Dashboard, located to the right of the task list.
Information note
Use the arrow to collapse or expand the Task Dashboard.
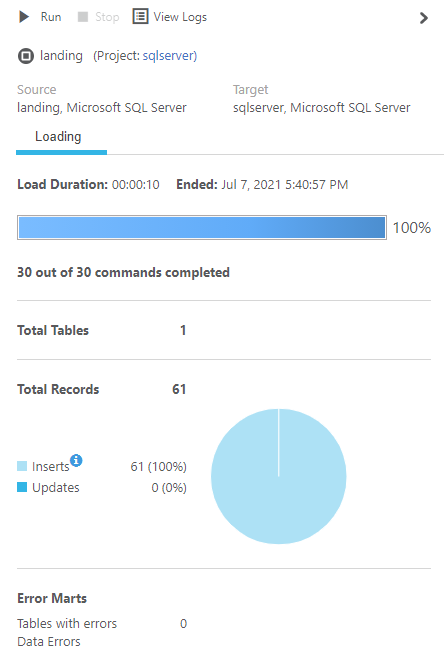
The top of the dashboard provides buttons for stopping and starting task(s), and viewing task log files. The following information about the task is also provided:
- The task name and state
- A link to the Compose project
- Source: The display name and type of the source database
- Target: The display name and type of the target database. Note that as the target database does not have a display name in Compose, the project name is displayed instead.
The Loading tab in the right pane shows the following task information:
- Load Duration - Load duration time
- Ended - Load end time
- Overall progress bar
- <n> out of <n> commands completed - The total number of ETL statements executed
- Total Tables - Total number of tables loaded
- Total Records - Total number of records loaded (also represented in a pie graph)
- Total number of INSERT operations
- Total number of UPDATE operations
- Error Marts (Not displayed for Data Mart tasks as Data Quality rules are run in the Data Warehouse only)
- Total number of tables with errors
- Total number of data errors

