Run and monitor the replication task
You can now run the replication task and see the results of the replication in real time. This task guides you through running the replication task as a full load and viewing the progress in the Monitor. Additional run options are also available. For more information, see Using the Run button options.
To run and monitor the replication task:
-
On the task tab, click Run.
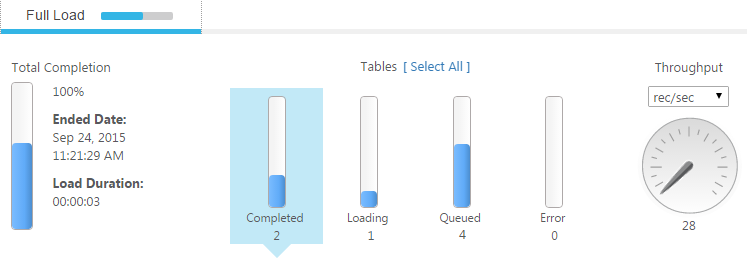
The Starting task message displays, and the console switches to Monitor view, which includes gauges and graphs on two tabs:
- Full Load tab: Indicates the status progress during the full load process.
- Change Processing tab: Monitors changes that occur after the full load completes.
For information on reading the data presented in these sections, see Viewing information in the monitor.

-
Click the Select All link above the Tables graphs. Replicate displays a table below the graphs with information about each of the tables being processed in the task.

-
Click the individual bar graphs, such as the Completed graph and the Loading graph, to view additional information.
For information about the data supplied in these tables, see Monitoring full-load operations.
