Data drift
Over time, your model's accuracy can decline because the data in one or more features changes in distribution, magnitude, and other properties. Because the original model was trained with features that contain specific patterns and distributions, future changes to these distributions will affect the precision and quality of predictions.
Data drift can be quantified and can be calculated in a number of ways. In Qlik Predict, data drift is calculated with the population stability index formula. See Monitoring data drift in deployed models.
A best practice is to monitor your model for data drift by comparing the original training dataset against the most up-to-date apply dataset on which you are generating predictions. When data drift reaches a specific threshold, re-train the model, or configure a new model if your original machine learning problem has changed substantially.
For more information about assessing model performance over time, see Evaluating model performance over time.
Example
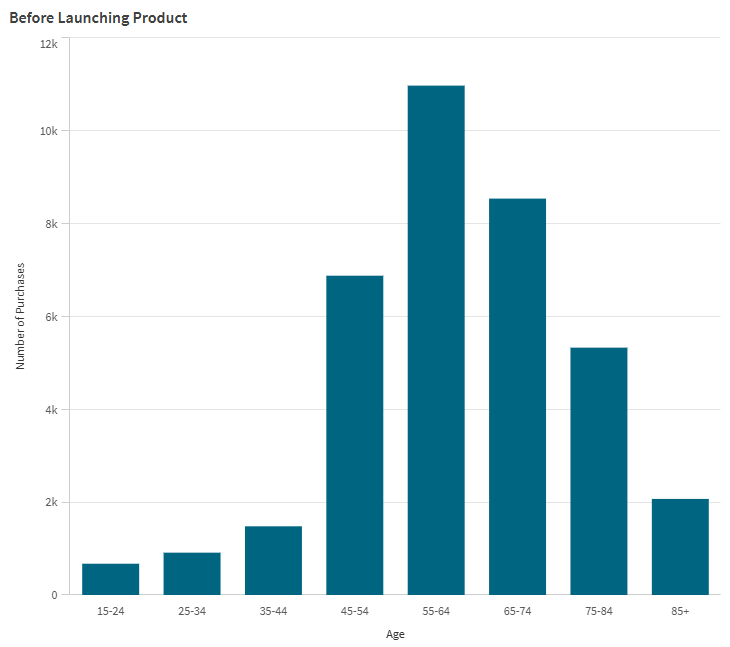
Suppose a company has a set of products that has been established to be popular mainly with consumers aged 45 and older. The value distribution for a feature Age might look like the following.
Bar chart showing company sales appealing more to consumers above the age of 45.

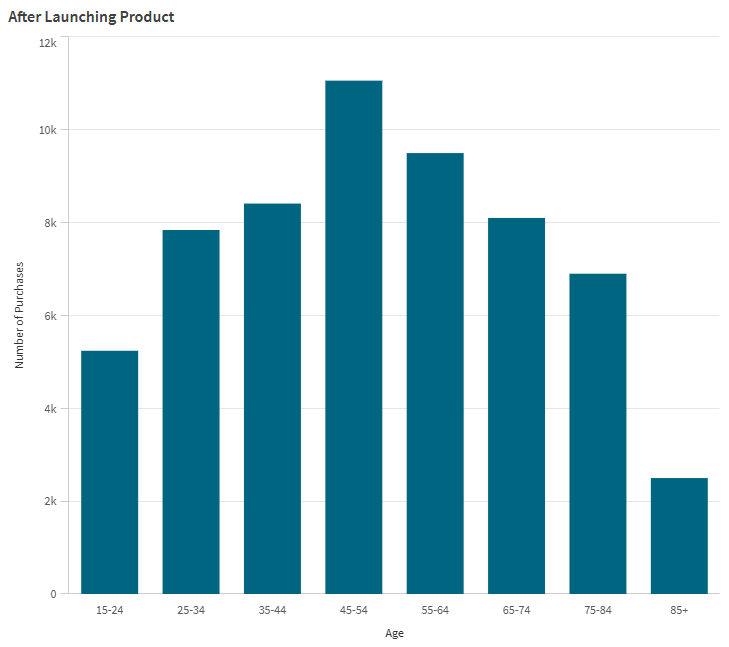
Recently, the company has introduced a new product that is marketed to also appeal to younger consumers as well. When the product sells as expected, we see a significant feature drift for the feature Age.
Bar chart showing company sales that are more evenly distributed, with the company sales appealing more equally to consumers of all ages.

Data drift monitoring in Qlik Predict
Qlik Predict has built-in tools to help you detect data drift on a per-feature basis within your deployed models. For more information, see Monitoring data drift in deployed models.
