Feature scaling
Features are the columns in your dataset that are used to predict a target value. The data values of the features will often have varying ranges. Feature scaling standardizes the range of values in numerical columns to distribute the values evenly. This makes it possible to relate otherwise unrelatable values.
Say that we are trying to predict whether a homeowner will default on their mortgage. In this case, interest rate and home value are going to have very different ranges and magnitudes. Standardizing each of these values relative to themselves allows them to be mathematically represented along the same plane. This can increase both accuracy and speed of model training.
How does feature scaling work
A common practice for feature scaling is to calculate the mean and standard deviation for each column. Then, for each row, calculate the number of standard deviations away from the mean.
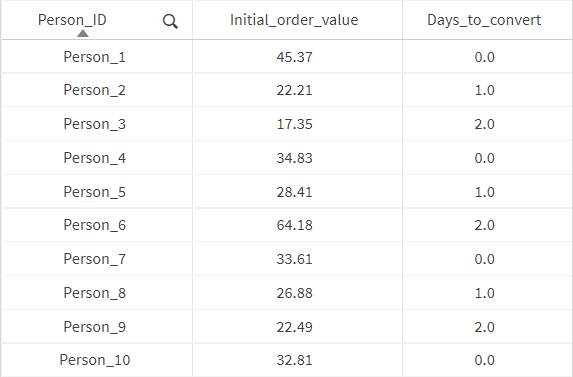
To illustrate this concept and practice, we have a table with the columns InitialOrderValue and DaysToConvert.
Table with original data. There is a big difference between the ranges in the two columns.

The mean value and the standard deviation is calculated for the columns. We can use these values to feature scale the original values. The feature-scaled value is the difference between the original value and the mean divided by the standard deviation.
Mean value and standard deviation

For the first record in our table, Person_1, the initial order value is $45.37. The mean for the initial order value is $32.81 and the standard deviation is $13.58. This gives us the feature-scaled value: ($45.37 - $32.81)/$13.58 = 0.925
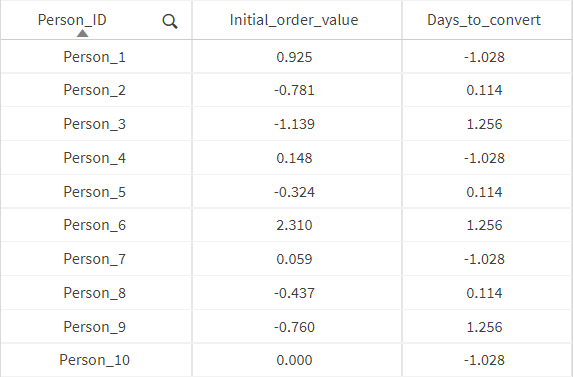
Note that the units ($) are canceled out by the division. This means that 0.925 is no longer measured in dollars, but in relative standard deviations from the mean. When we apply this to both columns, they are now on the same descriptive plane. The following table shows the feature-scaled values.
Table with feature-scaled data

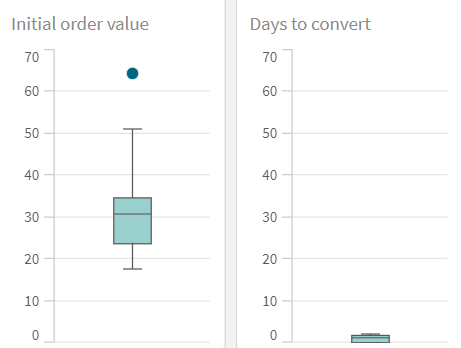
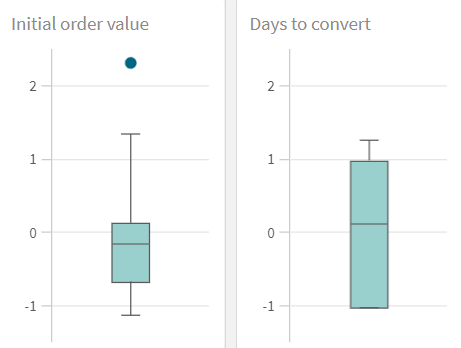
The difference between the original values and the feature-scaled values is visualized the following box plots.
Box plots of original data

Box plots of feature-scaled data

