Understanding permutation importance
Permutation importance is a measure of how important a feature is to the overall prediction of a model. In other words, how the model would be affected if you remove its ability to learn from that feature. The metric can help you refine a model by changing which features and algorithms to include.
Permutation importance is calculated using scikit-learn permutation importance. It measures the decrease in the model score after permuting the feature.
-
A feature is "important" if shuffling its values decreases the model score, because in this case the model relied on the feature for the prediction.
-
A feature is "unimportant" if shuffling its values leaves the model performance unchanged, because in this case the model ignored the feature for the prediction.
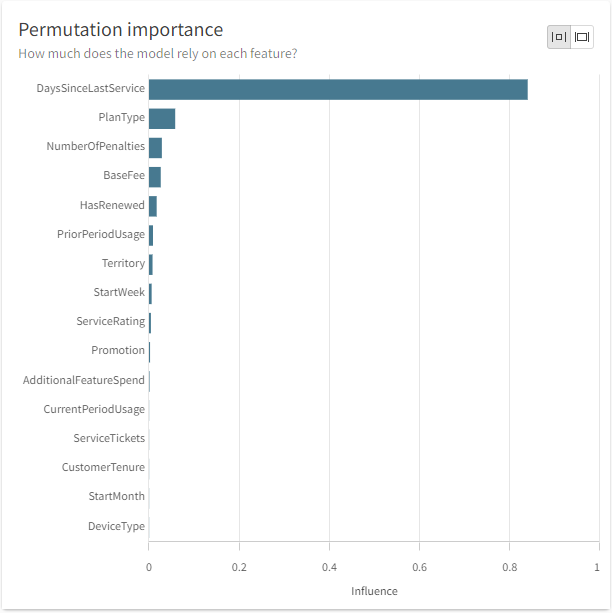
In the permutation importance chart, features are displayed in order from highest influence (biggest impact on model performance) to lowest influence (smallest impact on model performance). The bar size represents the importance of each feature.
A permutation importance chart is auto-generated for each model trained during an experiment. The chart is displayed in the Models tab.
Permutation importance chart

Using permutation importance to choose feature columns
When you iterate the model training, you can look at the permutation importance to determine which columns to keep and which columns to exclude. Note which features that are most important to multiple models. These are likely the features with the most predictive value and good candidates to keep as you refine your model. Similarly, features that are consistently at the bottom of the list likely do not have much predictive value and are good candidates to exclude.
If one algorithm scores significantly better than the others, focus on the permutation importance chart for that algorithm. If multiple algorithms have similar scores, you can compare the permutation importance charts for those algorithms.
Using permutation importance to choose algorithms
Each algorithm has a unique approach to learning patterns from the training data. Experiments are trained with multiple algorithms to see which approach works best for the specific dataset. The different approaches are reflected by variations in permutation importance for different algorithms. For example, feature A might be most important to the Logistic Regression model, while feature B is most important with XGBoost Classification's approach to the same data. In general, features with a lot of predictive power are expected to be top features across the algorithms, but it's common to see variation.
You can use this variation in permutation importance when you choose between algorithms with similar scores. Select the algorithm with top features that are more intuitive given your specific business knowledge.
Availability of permutation importance
Including free text features in your experiment increases the complexity of the experiment and the processes required to run it. It is possible that Permutation importance charts will be unavailable for the resultant models if your free text data is complex enough.
