Analyzing lineage in Data Integration
Lineage tracks data and data transformations backwards to the original source. Qlik Cloud provides a detailed visual representation of the history of this flow, where you can interactively examine the upstream lineage of a given data task, and the datasets and fields that are created by the data task.
The lineage of a data task summarizes its most important dependencies:
- Data tasks that are used to derive it
- Direct associations and dependencies, including owner and space
- Original source (the first known source)
To view downstream or forward-looking dependencies, you can investigate what elements would be affected by a change to the object by viewing Impact analysis. See Analyzing impact analysis in Data Integration.
To use lineage, you also need View lineage set to Allowed via User Default or custom security role.
The lineage graph
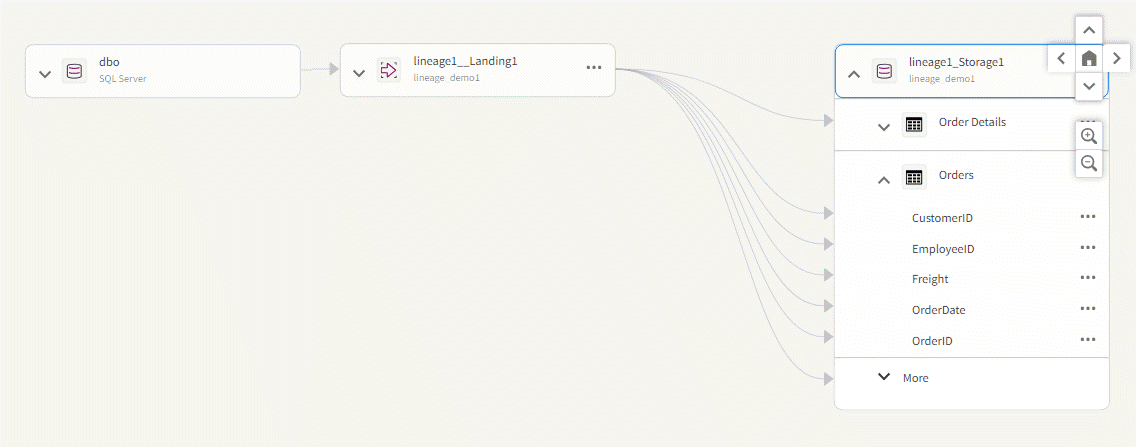
The lineage graph shows the flow of data through data tasks in an interactive, graphical chart. A data task is called a node in a lineage graph. When a node is the base node being investigated, it is said to be in focus and displays as the last element in the graph. At the most granular level, field-level lineage graphs show the data sources and transformations that a node is sourced from or dependent on.
Each node represents a step in the lineage of the selected data task. This lineage information is compiled whenever a data task is prepared or run.
Typical input nodes include data sources that are used by the base node. Field-level lineage allows for detailed investigation into how fields have been calculated and their specific origin across transforms.
The nodes available in a lineage graph are the inputs to your selected data task. Select a data task, dataset or field, to designate it as the base node. Input nodes are nodes that are upstream from the base node.
Field-level lineage graph

The nodes available in a lineage graph are the inputs to your selected base node, in other words the node in focus. The base node is the singular node for which you want to retrieve lineage; it is a data task, dataset, or field.
It will be the right-most node on your screen and outlined in blue. It is the focus of your investigation and only inputs to that base node will be presented.
While you explore the lineage, you can interactively change the base node to another data task, dataset, or field on the screen to focus your investigation.
The lines connecting the nodes are edges. Edges represent the relationship of a node to another node. They represent relationships indicating associations such as a dataset that is landed by a landing task. They can also represent data that is produced by a transformation. The collection of nodes and edges together make the lineage graph.
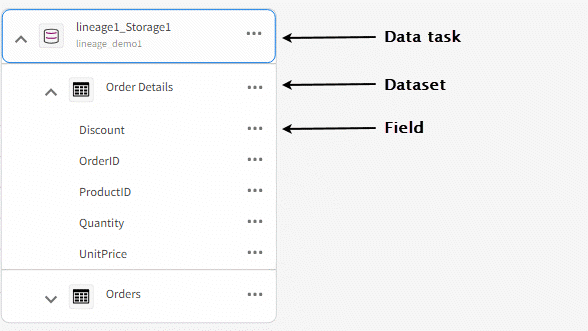
Nodes collapse or expand to reveal hierarchy levels from coarse to finer granularity beginning with the higher-level object down to the most granular level which is the field level.
Lineage node levels

Node details
Details are limited by your access to that object. Details can provide the following information:
-
Name
-
Description
-
Project
-
Data store
-
Space
-
Owner
-
Creator
-
Last modified
Navigating the lineage graph
Click and drag the graph to navigate and center the lineage graph. You can also use the navigation buttons. Select Home to center the lineage graph on the base node. Click back and forward to move around in your selections.
Lineage graph navigation

You can access lineage by selecting Lineage in the context menu on:
-
A data task in a data project.
-
A dataset in a data task.
-
A field in a dataset.
Expand or collapse
the nodes to expand or collapse groups of objects at the same level.
You can return to the data project or the data task.
-
Click
on any object, and then Open data project to return to the data project.
-
Click
on any object, and then Open data task to return to the data task.
Permissions
You must have permission to view tasks in the data space of the data project to view lineage. This means that you need to have either of the following roles:
-
Is owner
-
Can view
-
Can operate
-
Can edit
If you can see the lineage graph for a base node, you are able to see basic details for the upstream lineage objects.
Troubleshooting
For information about troubleshooting lineage errors, seeTroubleshooting - Lineage messages.
