Building a data flow
Creating a data flow
Start by creating a new data flow.
-
From the launcher menu, select Analytics > Create or Analytics > Prepare data.
-
Click Data flow.
The Create a new data flow dialog opens.
-
In the corresponding field, enter a Name for your data flow.
-
From the corresponding drop-down list, select in which Space you want to save the data flow.
-
Add a Description to document the purpose of the data flow.
-
Add some Tags to the data flow to make it easier to find.
-
Optionally select the Open data flow checkbox to directly view the data flow once it’s created.
-
Click Create.
Your empty data flow opens and you reach the Overview tab of the navigation header. The new data flow can also be found later in the Analytics > Home page of Qlik Cloud.
For more information on the information you can find in the overview of your data flow, see Navigating data flows.
To start designing your data flow, go to the Editor tab of the navigation header.
Selecting a source
The first building block of your data flow is the source that contains the data you want to prepare. You can use any data from your catalog or from a connection.
Adding data from a dataset
Datasets stored in your catalog can be based on files (.qvd, .xls, .csv, .parquet, .json, etc.) or tables from databases and data warehouses. See File formats for the list of supported formats.
Datasets created in Qlik Talend Data Integration as part of a data project can also be used to create data flows.
To select a dataset as source for your data flow:
-
From the Sources tab of the left panel, drag a Datasets source and drop it on the canvas.
The Data catalog window opens, where you can browse for previously uploaded datasets, or click Upload data file to browse for files on your computer and upload them on the fly.
Warning noteWhen uploading large files bigger than 300 MB, the process can take some time. Do not close the window, progress is displayed on a spinner that may look empty at the beginning. -
Using the search and filters, select the checkbox in front of one or more datasets from your list and click Next.
When selecting a dataset added from a connection in the catalog, and multiple connections match, you can use a drop down list to select the specific connection to use.

-
In the Summary tab, you can review the datasets you have selected, check the fields they contain, and exclude some if you want. Click Load into data flow.
The source or sources are added to the canvas, with a warning saying you need to connect them to other nodes.
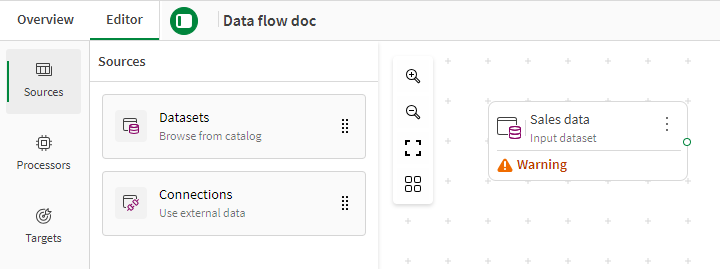
Once a source is placed on the canvas, you can click it and access the Properties panel to edit the selected fields if needed, if the schema of the source has been updated for example.
Uploading and configuring a csv file
If you are using a csv file dataset as source, either previously uploaded to your catalog or directly uploaded during the process, and the data does not display properly in the preview, it could mean that the file is not properly formatted.
For example, this customer data that uses comma as separator displays in a single column.
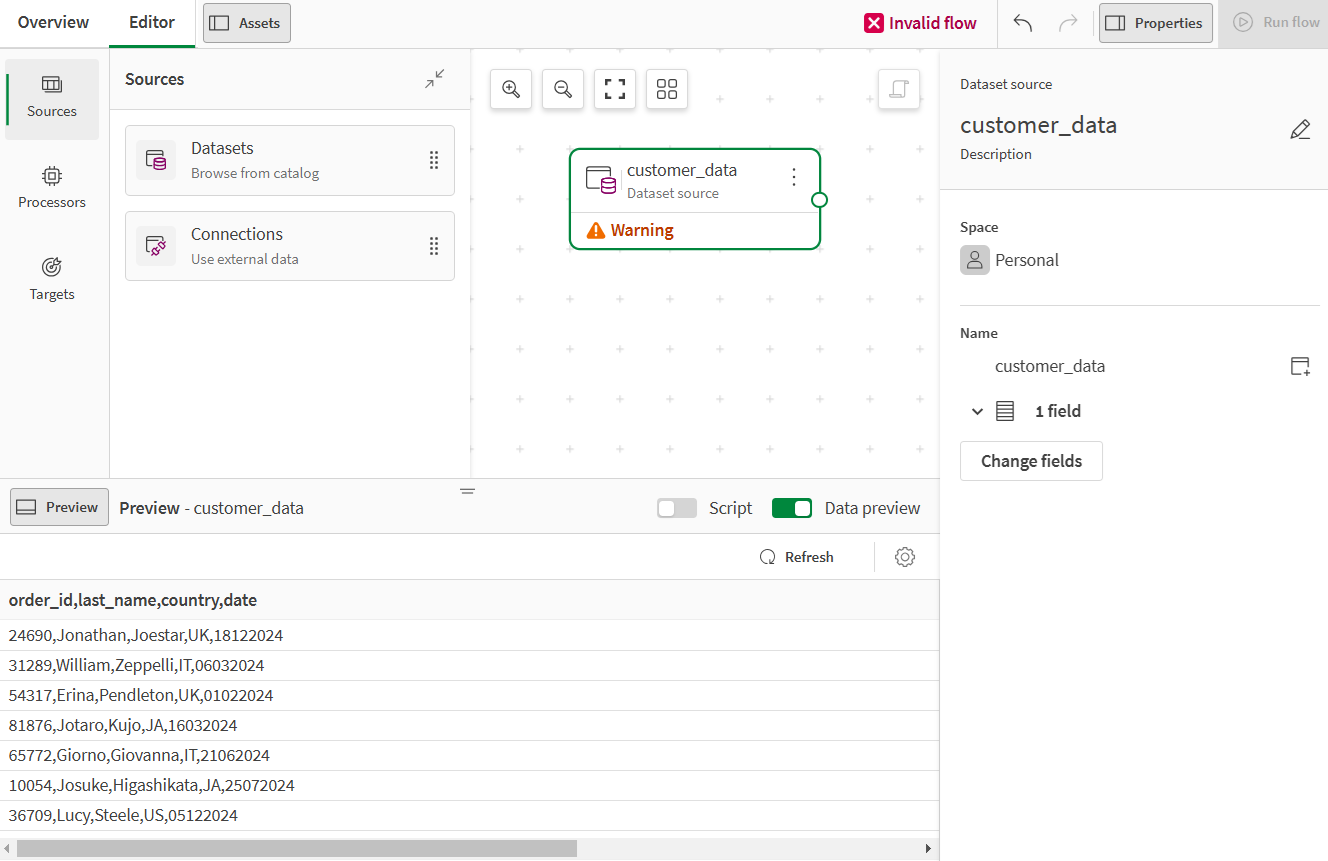
The file was either badly formatted, or the separator was not correctly detected during the upload. To troubleshoot this issue, you will need to go the dataset settings.
-
From the launcher menu, select Analytics > Catalog.
-
Open the dataset to fix.
In the dataset overview, you can see a warning saying that there is a potential formatting error.
-
Click the link to the File format settings from the warning message or use the More actions menu on the top right of the overview.
You can see that the delimiter was wrongfully set as Semicolon.

-
From the Delimiter dropdown list, select Comma.
With the expected delimiter, the preview now correctly shows the different fields.
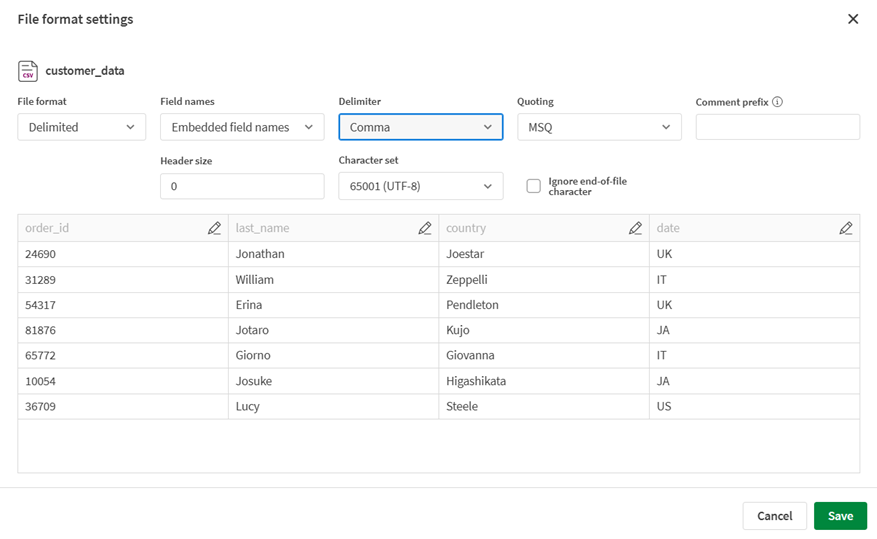
-
Click Save.
-
Back in your data flow, delete the outdated source if the canvas was not empty, and add it again. This time, the source will reflect the right dataset configuration.
Adding data from a connection
Qlik Cloud and data flows support a variety of connections to data sources. See the List of supported data sources for more information.
The only connection types that are currently not supported are the following:
To select a connection as source for your data flow:
-
From the Sources tab of the left panel, drag a Connections source and drop it on the canvas.
The Select connection window opens, where you can browse for previously created connections, or click Create connection to define a new one on the fly after authenticating.
-
Using the search and filters, select the checkbox in front of a connection from your list and click Next.
-
Depending on the connection, you will be able to browse files, enter a path to your data, or select tables from a database.
-
After selecting the source data, click Save or Finish.
The source is added to the canvas, with a warning saying you need to connect it to another node.
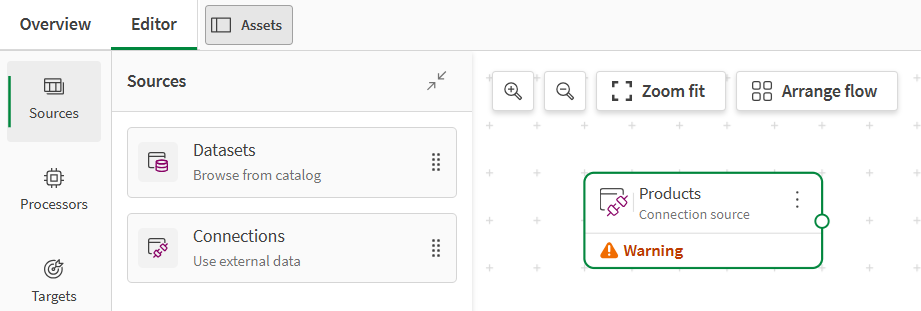
Once a source is placed on the canvas, you can click it and access the Properties panel to edit the selected fields if needed, if the schema of the source has been updated for example.
Adding processors
Processors are the building blocks that contain the different preparation functions available in a data flow. They receive the incoming data, and return the prepared data to the next step of the flow. Processors allow you to perform complex extract, improve and cleaning operations on diverse data with a live preview. See the full Data flow processors for more information on the available functions.
To connect a first processor to your data source:
-
You can either:
-
From the Processors tab of the left panel, drag the processor of your choice and drop it on the canvas next to your source.

You will need to manually connect the source and the processor. Create a link by clicking the dot on the right of the source node, holding, and dragging the link to the dot on the left of the processor node.

-
Click the action menu of the source, select Add processor, and click the processor of your choice.
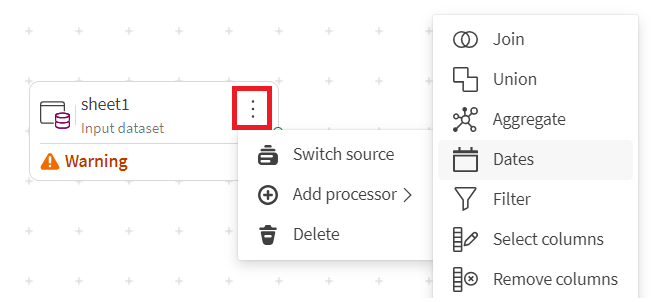
The processor is placed on the canvas and automatically connected to the source.
-
-
Click the processor to start configuring it in the right panel.
The different functions available, and the parameters to configure, depend on each processor. See the individual processor documentation for more information.
-
Click Save.
-
Add and connect as many processors as needed to prepare your data.
Activate the Data preview switch in the Preview panel to see the effects of a processor on a sample of your data. Click the cog icon to open the preview Settings and configure the sample size up to 10000 rows. You can also activate the Script switch to look at the Qlik Script equivalent of your data flow at this point.
Selecting a target
To end the data flow, you need to connect the last processor to a target node. You can choose between two target types:
-
Data Files for files stored in your catalog in Qlik Cloud.
-
Connections to write in an external source added as connection in Qlik Cloud.
Both options allow you to export the prepared data as a .qvd, .parquet, .txt or .csv file.
To connect a target to the rest of the flow:
-
You can either:
-
From the Targets tab of the left panel, drag the target type of your choice, and drop it on the canvas next to the last processor.

Manually connect the last processor to the target in the same way you connected processors previously.
-
Click the action menu of the last processor, select Add target, and click the target of your choice.
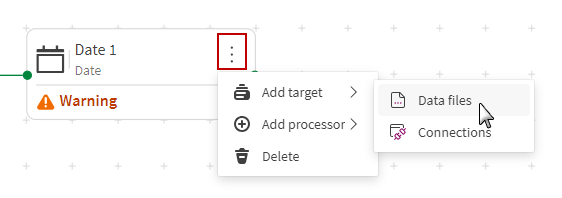
-
-
Click the target to start configuring it in the right panel.
Information noteIn the case of Data files, you can write in a specific folder of the desired space. If you have created a folder called folder_name in your personal space for example, use folder_name/data_flow_output.qvd as file name for your target. The resulting file will be directly sent to your folder. -
Click Save.
With a minimum of one source, one target, and an optional processor, the data flow can now be run.
Running the data flow
When all the nodes of your data flow are connected, configured, and marked as OK, a green check mark shows that the data flow is considered valid and can be run. At this point, it is possible to use the Preview script button on the top right of the canvas to look at the full script that will be generated behind the scene.

-
Click Run flow to start processing the data.
A notification opens to show the status of the run.
-
When the flow has successfully completed, the prepared data that has been output can be found at different places according to the target:
-
In your Catalog among your other assets, and in the Outputs section of the data flow Overview for data files
-
In the Outputs section of the data flow Overview for connection-based datasets.
If the flow happens to fail, you can open the run log to help you identify what went wrong.
-
You can now use this prepared data as clean source to feed an Qlik Predict experiment, or in a visualization app.
