Information about applied changes
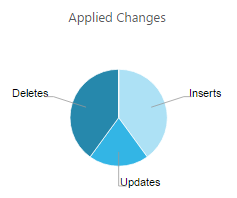
To view more information about applied changes, in the <task name> tab, click the Applied Changes pie chart. The Applied Changes pie chart displays two grids, each in its own tab, with information about the applied changes.

Recent Activity
The grid in the Recent Activity tab includes information about which changes occurred in each table:
- Table Name: The names of the source tables that are included in the task.
- Update: The number of UPDATE operations processed for the specific table.
- Insert: The number of INSERT operations processed for the specific table.
- Delete: The number of DELETE operations processed for the specific table.
- DDL: The number of metadata changes (DDL) processed. DDL changes include information about events like changes to table names or to column names.
- Total Applied: The total number of changes applied to the target.
- Data Errors: The number of errors related to data processing at the record level, such as conversion errors, errors in transformations, or bad data.
- Last Modified: The time the last change occurred for the specific table.
You can also:
- Filter the grid by entering a string in the Filter By box. This allows you to focus on specific tables.
- Reload tables. To reload selected tables, select the tables you want to reload and then click Reload above the table list. When prompted to confirm the operation, click OK. The data in the selected tables will be reloaded to the target endpoint. Note that this option is not available for Apply Changes Only tasks.
- Reset data errors for a specific table. For details, see Data error handling.
- Use the Columns Settings dialog box to select which columns to display and to arrange the order in which they appear. For more information, see Customizing task columns.
- Hide a column, export the list to a TSV file, or sort by column in ascending or descending order. For more information, see Customizing task columns.
Aggregates
The grid on the Aggregates tab includes information about the total number of changes (for all tables) per change type (INSERT, UPDATE, DELETE, DDL) and transaction type (COMMIT, ROLLBACK).
