This step-by-step walkthrough shows how you can use forced concatenation to combine two similar data tables.
Forced concatenation can be used to clean up your data before you use it for analysis in a sheet. You can concatenate two tables into one table. You can also add another table later, for example if you initially add a table from June, and then later want to add a second table from July.
Concatenation at a glance
- Tables are automatically concatenated in Data manager when Qlik Sense detects that one or more added tables have both the same number of fields and identical field names as another table. In this case, you can split the tables if needed.
- Two tables can be force concatenated when tables do not entirely share the same fields or data. Only two tables can be force concatenated. To concatenate three tables, for example, concatenate the first two tables into one table. Concatenate the third table to that created table.
- Tables that are not similar enough will not automatically be concatenated. You also will not be able to forcibly concatenate them. In this case, the fields in the table should instead be associated in the Data manager.
Walkthrough - Forced concatenation
These are the tasks required to complete the walkthrough:
- Prepare the data tables
- Add data tables to an app
- Concatenate and load data tables into an app
- A step further - adding a new table and concatenating the data fields
Prerequisites
You should know how to create an app in Qlik Sense. For more information, see Creating apps and adding data.
Prepare the data tables
We have supplied some sample data for you to use to demonstrate forced concatenation. You can also use your own data, provided the fields and data are mostly the same in your two tables.
For example, here is the header and first row of the data that we supplied below. It has been pasted into two Excel tables. Note the differences in the fields.

If you want to use the sample data, expand the section below, and copy the tables, including the column headings, into two separate tabs in an empty Excel file on your computer. For this walkthrough, we named the Excel tabs Data Table 1 and Data Table 2. We named the Excel file Concatenate_Data.xlsx.
Add data tables to an app
Do the following:
- Start Qlik Sense.
- Click Create new app in your work area. The Create new app window opens.
- Name your app, and then click Create. The app is created. We named our app ConcatenateExample
- Click Open app. The app opens and displays a dialog where you can add data.
-
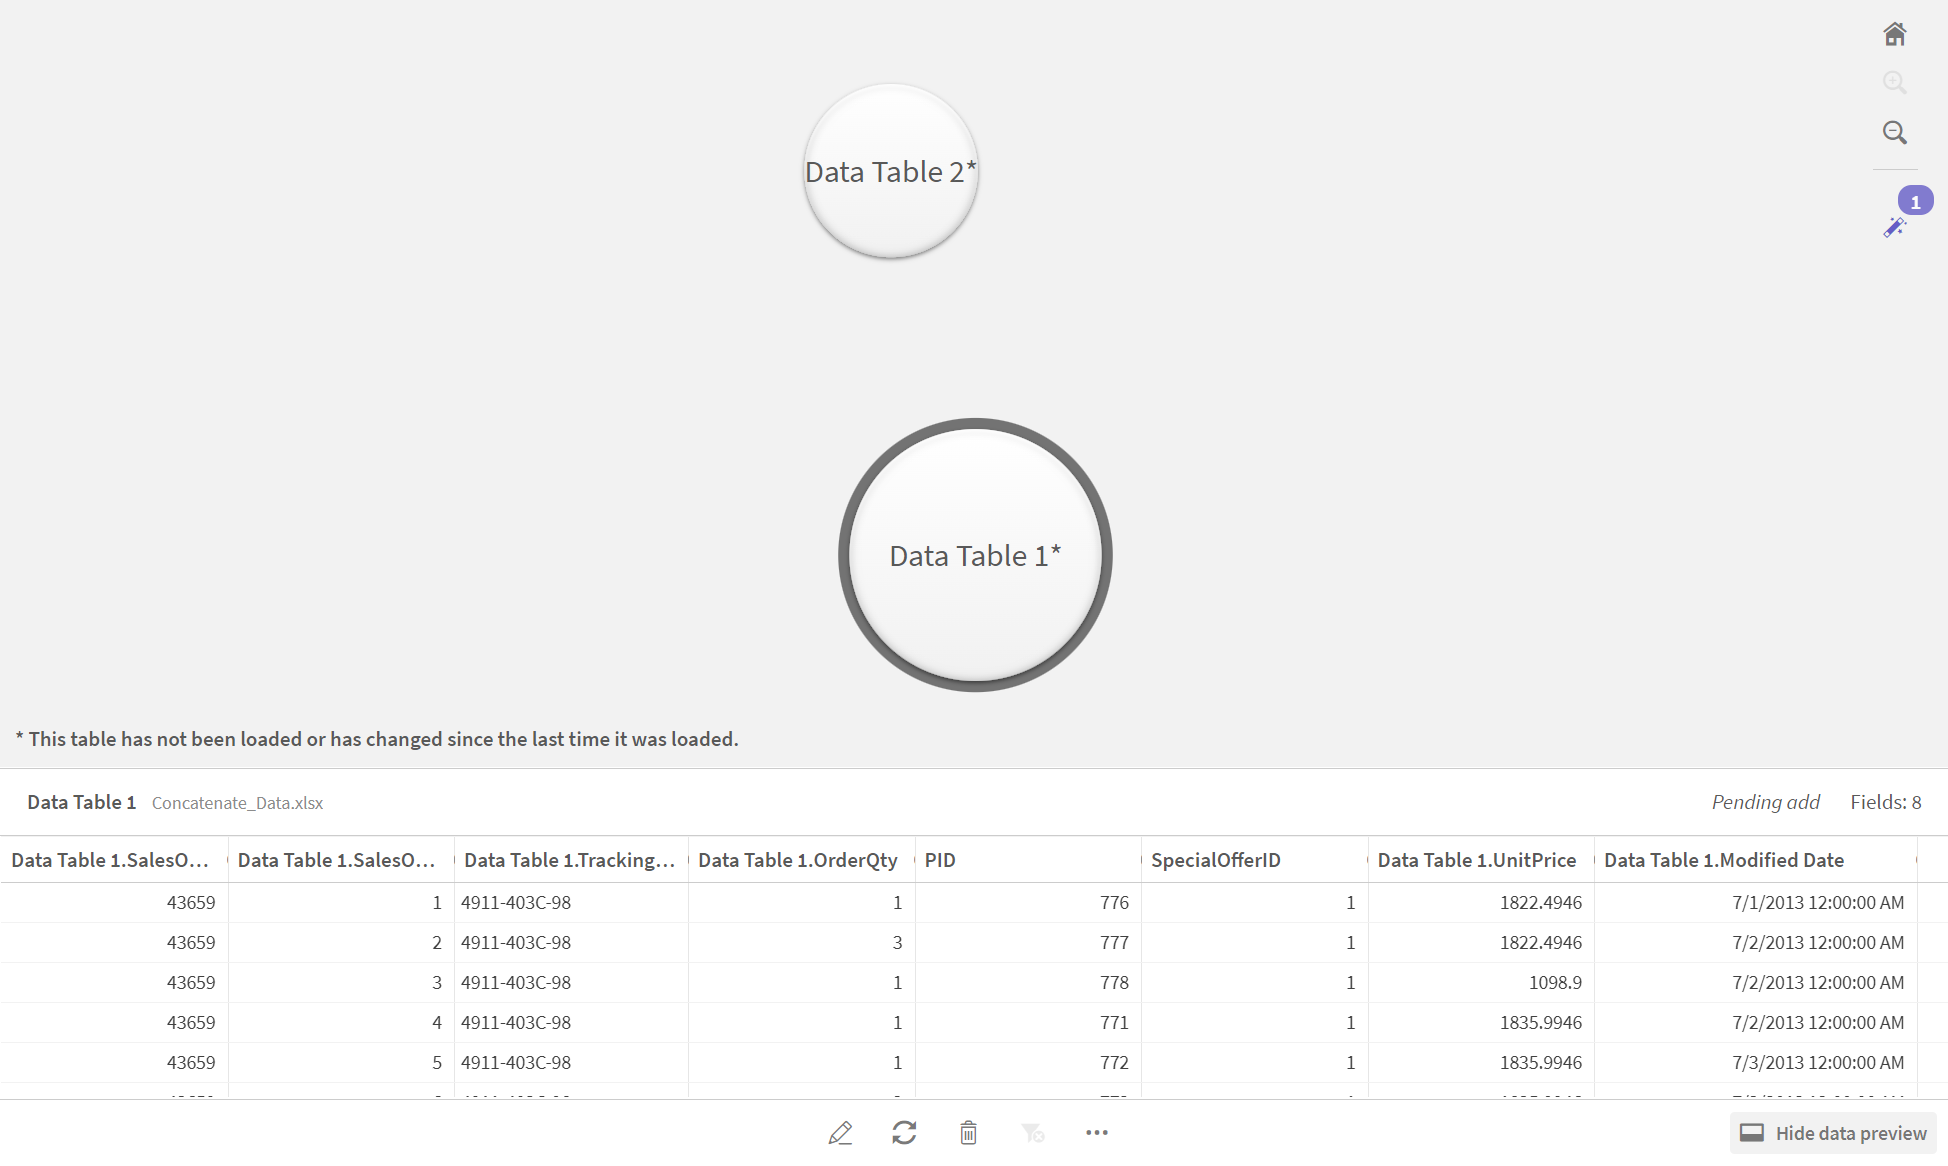
Drag and drop your Excel file into the Add data from files and other sources dialogue. Your tables are displayed in the Associations view of the Data manager. Click a bubble to see the data for that table.
Information noteIf you add data instead from Data manager, you will first be asked to select table fields before being taken to the Associations view of the Data manager. In this case, select all the fields for both tables.
Concatenate tables and load data tables into an app
After the data tables have been added to the app, the tables can be concatenated.
Do the following:
-
In the Associations view of Data manager, select one table by clicking the bubble. Click
and then select Concatenate or join.

-
Click the bubble for the other table, and then click Edit mappings.

-
You can now do the following as required:
- In Table name, rename the table that will be created when you combine the tables.
- Combine fields by dragging and dropping field labels.
- Rename fields.
- Delete fields by clicking
for the field.

In our example, we did the following:
- Renamed our table to Data Table.
- Dragged the ProductID label and field to below the PID field, to combine the fields.
- Renamed the PID field to Product ID.
- Deleted the SpecialOfferID field.
Our table now looks like this:

-
In the Selection action drop-down, click Concatenate, and then click Apply. The tables are concatenated on the mapped fields. The * indicates that the data has not yet been loaded into the app.

- Click Load data. A message is displayed indicating that the data was loaded successfully. Click Edit sheet to create visualizations using the data.
A step further - adding a new table and concatenating the data fields
The sample data provided above was pasted into two tabs in the same Excel file. However, the tables do not need to be in same file when you want to concatenate fields. The tables can be in separate files that are added to the app. Another table can also be added later, for example if you initially add a table from June, and then later want to add a second table from July.
In this example, we add another table with similar fields to the concatenated table we created above.
Here is the sample data. We named the tab that contains the table DataTable_Newest. We named the data file Concatenate_Data2.xlsx.
Do the following:
-
From the Analytics activity center, click the app that you created in the procedures above. The app opens.
-
Select Data manager from the drop-down list in the top toolbar. The Data manager opens and the table you created in the procedure above is shown.

- Click the
button to add data.
-
Click Data files in the left menu, and then click DataFiles under Folder shortcuts. Upload your new data file.
- Select the file. The Add data window opens.
-
Click Add data to add the data table to the app.
The new table is added to your app.

- You can now concatenate the tables, edit the mappings, and then load the data.
