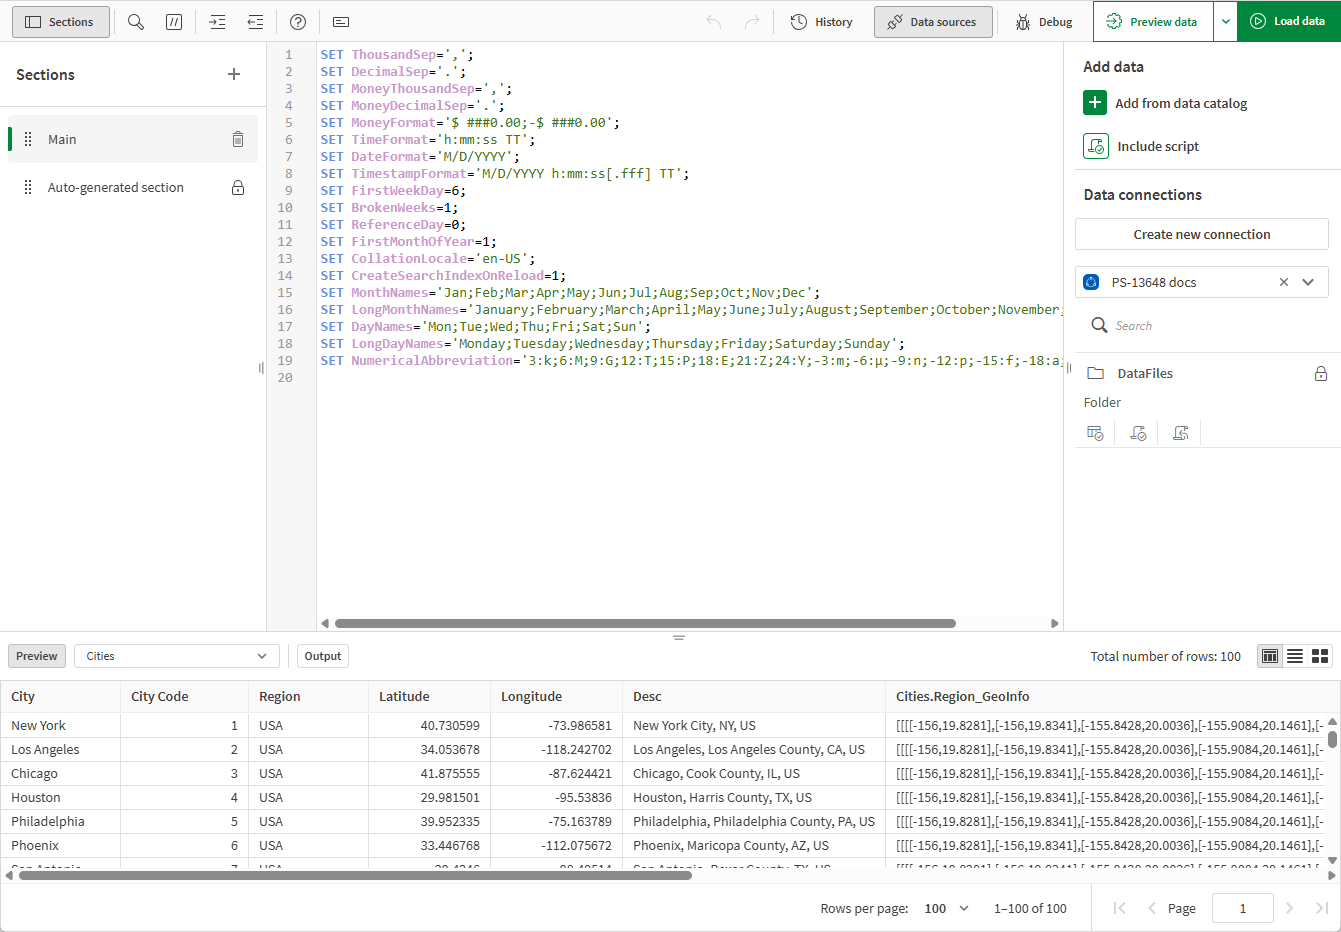
Create and run data load scripts from the data load editor, and create connections to data sources. When you have loaded the data it is available to the app for analysis.
Click Data load editor in the app navigation menu to open the data load editor.
Data load editor

Toolbar
Toolbar with the most frequently used commands for the data load editor.
To learn more about the data load script, see:
- Saving the load script
- Debugging the data load script
- Running load scripts to load data in apps
- Previewing data in load scripts
History
In History, you can view and manage previous version of your load script.
Data sources
Add data to your app to your load script.
Add data
Under Add data, you can access the data catalog. The data catalog allows you to load data from all the existing datasets to which you have access. You can load data from multiple datasets at the same time using data catalog.
Include scripts
In addition to datasets, you can select QVS files and other scripts to insert into the load script. The data catalog allows you to select any uploaded QVS file or other script to which you have access.
Inserting other scripts into load scripts
Data connections
Under Data connections you can save shortcuts to the data sources (databases or remote files) you commonly use. This is also where you initiate selection of which data to load. Data connections are sorted by the spaces to which you have access.
For more information, see Loading analytics data and Selecting data in load scripts.
Text editor
You can write and edit the script code in the text editor. Each script line is numbered and the script is color coded by syntax components. The text editor toolbar contains commands for Search and replace, Help mode, Undo, and Redo The initial script contains some pre-defined regional variable settings, for example SET ThousandSep=, that you can optionally edit. For more information, see Modifying regional settings for apps and scripts.
To learn more about script, see Editing load scripts and Script syntax overview.
Sections
Divide your script into sections to make it easier to read and maintain. The sections are executed from top to bottom.
If you have added data using Add data, you will have a data load script section named Auto-generated section that contains the script code required to load the data.
For more information, see Organizing load scripts.
Preview
Once the script has been run either with Preview data or Load data, you can view a preview of the loaded tables under Preview.
Preview offers three different views of table data:
-
Table view
-
List view
-
Tile view
Table view
The data view displays data in a table format.
List view
The list view shows a summary of information about the fields and their values.
You can control what columns display by clicking and selecting the desired columns. Selections do not carry over between sessions. The following columns are available:
-
Name: Field name.
-
Data type: Type of data in the field
-
Distinct values: Count of distinct values in the field
-
Null values: Count of null values in the field
-
Sample values: Selection of sample values from the field
-
Sum: If the field is numeric, a sum of the field values
-
Min: If the field is numeric, the lowest value
-
Max: If the field is numeric, the greatest value
-
Average: If the field is numeric, the average value
-
Median: If the field is numeric, the median value
-
System Tags: Tags added to the data by the Data Profiling Service
-
Standard deviation: If the field is numeric, the standard deviation of the values
-
Positives: If the field is numeric, the number of positive values
-
Negatives: If the field is numeric, the number of negative values
-
Zero values: If the field is numeric, the number of zero values
-
Empty strings: If the field is textual, the number of empty strings
-
Min length: If the field is textual, the number of characters in the shortest string
-
Average length: If the field is textual, the average number of characters per string
-
Max length: If the field is textual, the number of characters in the longest string
-
First sorted value: First value, alphabetically or numerically, in a field
-
Last sorted value: Final value, alphabetically or numerically, in a field
-
Numeric values: Number of numeric values in a field
-
Text values: Number of text values in a field
-
Most frequent values: Three most repeated values from the field
-
Frequency distribution: If the field is numeric, the frequency distributions of the values
Tile view
The tile view displays available fields with a graphical profile of the data. Depending on the values in the field, each tile displays one of the following visualizations:
-
A list of the top three distinct values from the field with a count of each value's instances.
-
An area chart showing the range of values, with the average value highlighted.
Output
Output displays the autosave status and all messages that are generated during script execution.
