Navigating the PixelPerfect designer
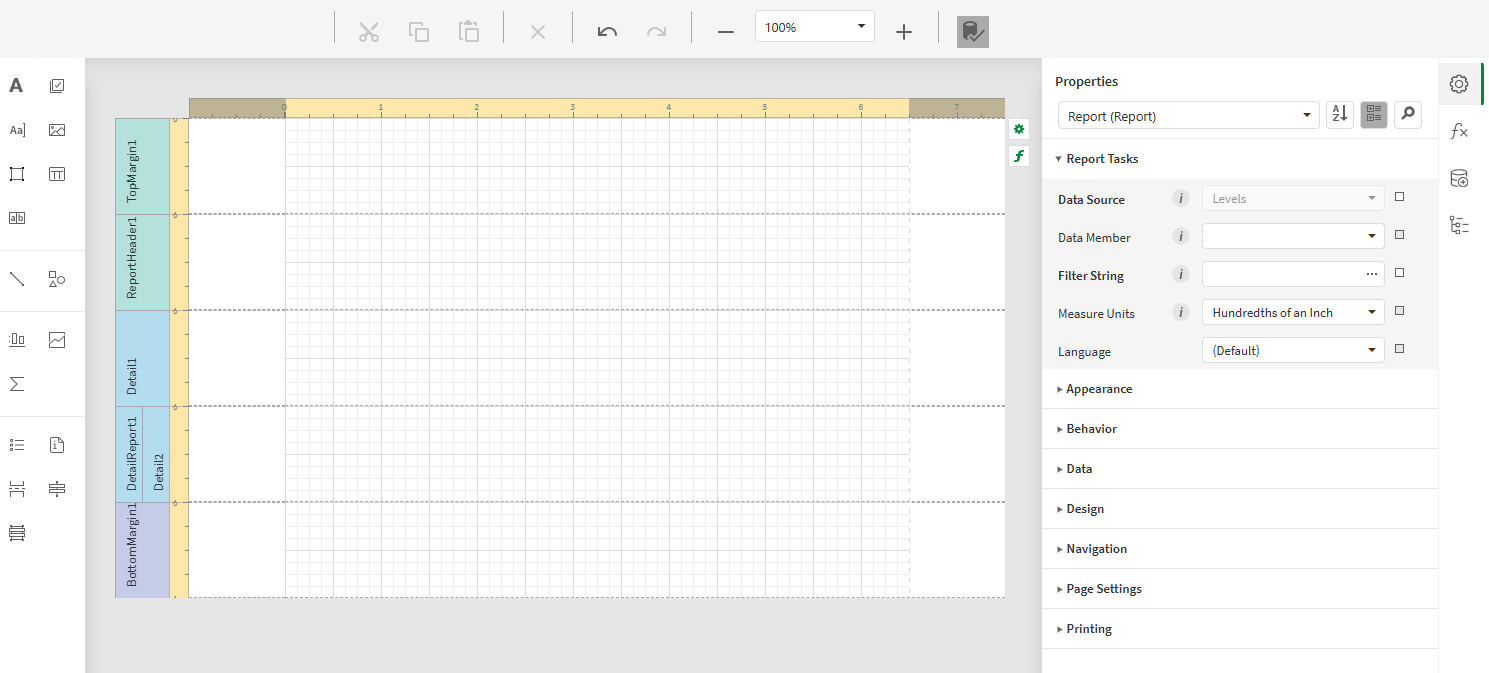
The PixelPerfect designer is where you construct PixelPerfect report templates. The designer is embedded within Qlik Sense apps. You access the designer by creating or editing a PixelPerfect template in the Templates tab in the Reporting section of your app.
The PixelPerfect designer

Designer toolbar
The designer toolbar is located at the top of the PixelPerfect designer. In the toolbar, perform common actions on elements in your report template. For example, you can cut, copy, and paste objects in the template, delete objects or bands, and adjust the zoom for the design surface.
Toolbox
The toolbox is the panel on the left side of the designer. From the toolbox, drag and drop report controls onto the design surface. Some controls need to be linked to data bindings when you add them from the toolbox. Others are used only for styling and formatting your report.
Design surface
The design surface is shown in the center of the designer. This is where your template content is shown. It is a canvas where you add objects to define the structure and content of your report. The band structure of the template is shown on one side of the canvas.
For more information, see:
Side panel
The right-side panel is expandable and allows you to configure report data sources, properties, and other parameters. Click one of the following icons on the right edge of the designer to open these menus:
-
Properties: Configure properties for the selected band or object. If nothing is selected, the global report properties are shown.
-
Expressions: Configure expression-based properties for the selected band or object. If nothing is selected, the global expression properties for the report are shown.
-
Field List: Add data bindings, reusable data entities from the Qlik Sense app. You can add different types of data bindings to suit a variety of content use cases: levels, images, tables (used only for native PixelPerfect visualizations), variables, and expressions.
-
Report Explorer: View the structure of the report as a hierarchical structure. You can reorganize objects and bands within the report structure by dragging and dropping.
Other interfaces in the designer
As you work in the PixelPerfect designer, you will interact with other interfaces. The following sections outline some notable examples.
Chart Designer
The Chart Designer opens when you are creating a native PixelPerfect chart. With the Chart Designer, configure the data bindings used in the chart, the chart type, and choose how you want to present each data series you have added.
Open the Chart Designer by clicking Run Designer... within a Chart object you have added to the template from the toolbox.
For more information, see:
Expression Editor
The PixelPerfect Expression Editor opens whenever you edit an expression-based property. The Expression Editor offers extensive control over how properties are defined. You can use the Expression Editor to configure bookmarks, conditional formatting, and more.
Open the Expression Editor by selecting an item on the design surface, and clicking the icon on the right side of the designer. Alternatively, click the bold f icon that pops up when you select the item.
For examples showing use of the Expression Editor, see:
Filter Editor
You can use the Filter Editor to filter data in your PixelPerfect template. The Filter Editor is available for any report content for which you can configure the Filter String property.
For more information, see:
