
How I made this: Dissolving regions and subregions
You can create custom regions using the dissolve operation. Using drill-down dimensions, you can create a hierarchical relationship between the multiple dissolved areas.
In this example, a map has been added that has US states dissolved into regions and subregions. The maps use a drill-down dimension to create the hierarchy between region, subregion, and state.

When you select a region, it drills down to the component subregions.
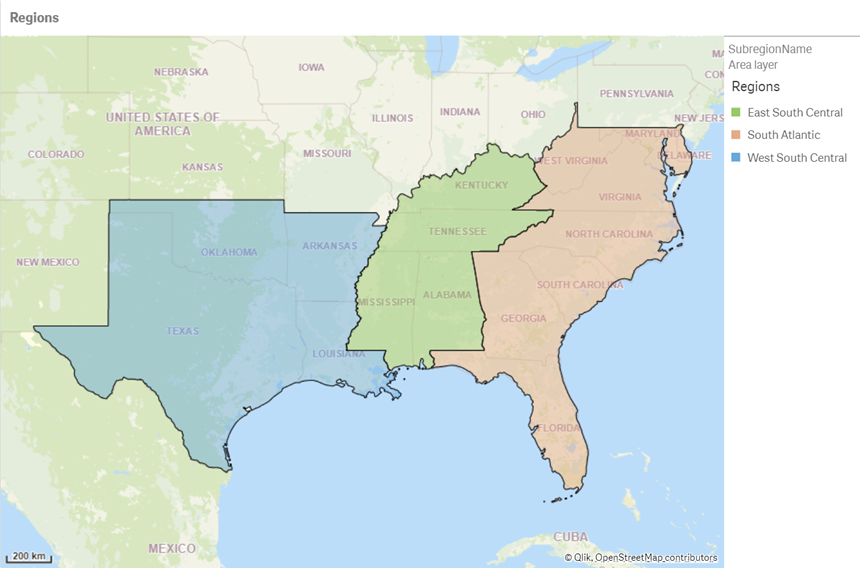
Selecting a subregion then displays the component states.

Two drill-down dimensions are used to make this map. One contains the names of the regions and states. The second contains the geometry and is used as the location field.
Data
This example uses a single data set that is added inline in data load editor.
How I built this
- Add the data into Data load editor.
-
Add the following dissolve functions:
SubRegionAreas:
Load * Extension GeoOperations.ScriptEval('
Select DissolvedPolygon as SubregionPolygon, SubregionName FROM Dissolve(dissolveField="SubregionName", resolution="Source", areaDatasetKeyField="State")
DATASOURCE subregions INTABLE keyField="State", namedAreaField="State"', Regions);
RegionsAreas:
Load * Extension GeoOperations.ScriptEval('
Select DissolvedPolygon as RegionPolygon, RegionName FROM Dissolve(dissolveField="RegionName", resolution="Source", areaDatasetKeyField="State")
DATASOURCE regions INTABLE keyField="State", namedAreaField="State"', Regions);
Select statements must be added to rename the default fields created dissolve when there is more than one dissolve operation in the load script.
- Load the data.
-
In the sheet view, create a drilldown dimension called Regions. Add the following fields to it, in order:
- RegionName
- SubregionName
- State
-
Create a drilldown dimension called RegionPolygons. Add the following fields to it, in order:
- RegionPolygon
- SubregionPolygon
- State
- Add a map.
-
Add an area layer using Regions as the dimension. Set the following properties:
- In Location, set the Location field to RegionPolygons.
- In Colors, set Colors to Custom and do the following:
- Select Persistent colors
- Select 100 colors.
- Set Opacity to 50%.
- Set Outline color to 000000.
- Center the region in the map and then set Limit pan navigation to Custom and click Set pan limit.