
How I made this: Overlapping travel areas
You can generate multiple travel areas in a single field and use them in an area layer. For example, you may want to view see incremental increases in travel areas for a single point.
In this example, a map has been added that has a 60 minute travel area for Canadian provincial and territorial capitals in 10 minute increments
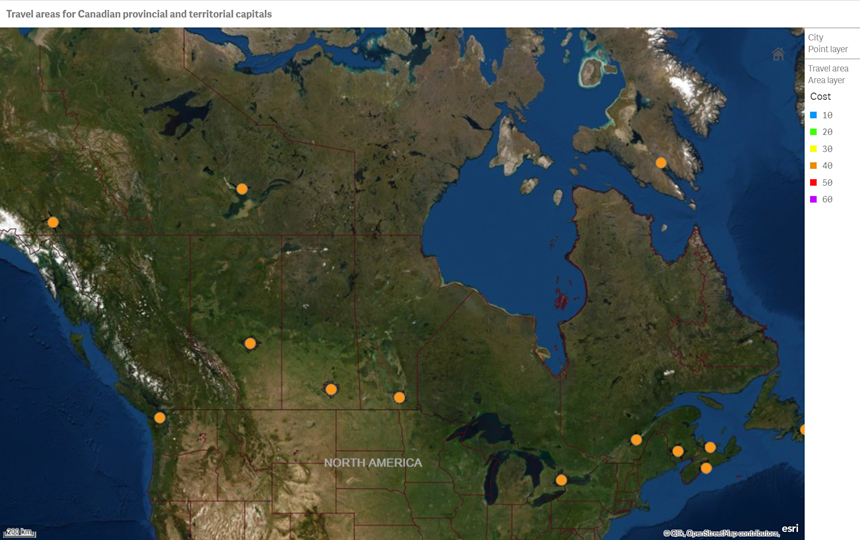
Map containing 60 minute travel areas for Canadian provincial and territorial capitals
When you click on point for a city, the map zooms in more closely, making it easier to see the travel areas for the city.
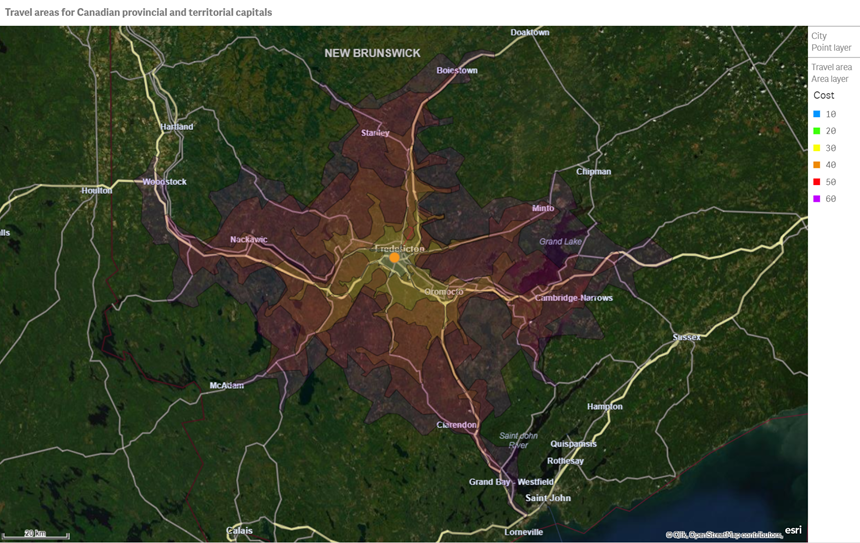
Zoomed in view of the travel areas of Fredericton
The cost values for the area layer have been sorted so that the areas are overlaid on the map from greatest area to smallest area. This enables the smallest areas to be selected by users as otherwise they would be overlaid with the larger areas that overlap with them.
Data
This example uses a single data set that is added inline in data load editor.
[Cities]:
LOAD * inline
[
City
Edmonton,Canada;
Victoria,Canada;
Winnipeg,Canada;
Fredericton,Canada;
St. John's,Canada;
Halifax,Canada;
Toronto,Canada;
Charlottetown,Canada;
Quebec City,Canada;
Regina,Canada;
Whitehorse,Canada;
Iqaluit,Canada;
Yellowknife,Canada;
]
(delimiter is ';');
How I build this
- Add the data into Data load editor.
-
Add the following travelArea script:
Load * Extension
GeoOperations.ScriptEval('TravelAreas(costValue="60",costUnit="minutes",transportation="car")
DATASOURCE Cities INTABLE keyField="City", namedPointField="City"', Cities {City});
Load * Extension
GeoOperations.ScriptEval('TravelAreas(costValue="50",costUnit="minutes",transportation="car")
DATASOURCE Cities INTABLE keyField="City", namedPointField="City"', Cities {City});
Load * Extension
GeoOperations.ScriptEval('TravelAreas(costValue="40",costUnit="minutes",transportation="car")
DATASOURCE Cities INTABLE keyField="City", namedPointField="City"', Cities {City});
Load * Extension
GeoOperations.ScriptEval('TravelAreas(costValue="30",costUnit="minutes",transportation="car")
DATASOURCE Cities INTABLE keyField="City", namedPointField="City"', Cities {City});
Load * Extension
GeoOperations.ScriptEval('TravelAreas(costValue="20",costUnit="minutes",transportation="car")
DATASOURCE Cities INTABLE keyField="City", namedPointField="City"', Cities {City});
Load * Extension
GeoOperations.ScriptEval('TravelAreas(costValue="10",costUnit="minutes",transportation="car")
DATASOURCE Cities INTABLE keyField="City", namedPointField="City"', Cities {City});
- Load the data.
-
In the sheet view, add the field Cost as a master dimension called Cost. Assign these colors to the following values:
- 10: 0096ff
- 20: 40ff0c
- 30: faff09
- 40: ee8a03
- 50: ff020d
- 60: c100ff
- Add a map.
-
Add a point layer with City as the dimension. Set the following properties:
- In Color, set the Color to #f8981d.
-
Add an area layer with TravelArea as the dimension. Set the following properties:
- In Dimensions, change Label to Travel area.
- In Colors, do the following:
- Color By dimension using the master dimension Cost and enable Library colors.
- Set the Outline color to 000000.
- Set Opacity to 50%.
- In Sorting, set Travel area to sort numerically and by descending value.
- Center the region in the map and then set Limit pan navigation to Custom and click Set pan limit.