Example - Creating a profit and loss table with vertical bands
In this example, you will use vertical bands to create a profit and loss report outlining the total sales and profit for each year in the app.

Background
Vertical bands allow you to arrange report content differently than horizontal bands. Rather than a standard relational table, vertical bands form a structure where each column corresponds to a single value from a dimension in your app—for example, a year, month, or category dimension. Other columns of interest are organized as rows rather than columns. The classic example of vertical bands is the profit and loss report, where the profit and loss fields are listed as rows in the table, and each column in the table represents a single year, quarter, or month value.
For more information about vertical bands, see Working with vertical bands in PixelPerfect reporting.
Preparations
Refer to the example app sources here: Example materials - In-app reporting. Upload the app and data files into a space, and then reload the app. You are ready to complete the example.
Step 1: Create data binding
Do the following:
-
Create a new PixelPerfect template.
-
Open the
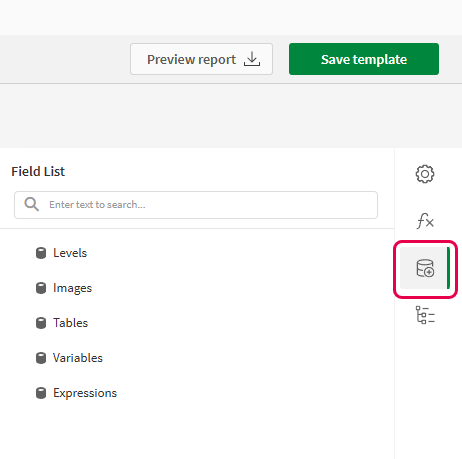
Field List menu available from the right-side panel in the designer.
Field List menu in the PixelPerfect designer

-
Hover your cursor over Levels, and then click
.
-
Expand the Sales Tables sheet. Next to P&L by Year, click
.
The data binding is created.
Step 2: Create the banded structure
Do the following:
-
On the design surface, right-click anywhere within the Detail1 band and click Insert Band > DetailReport.
A new DetailReport band is inserted below Detail1.
-
Right-click the DetailReport band. Click Insert Vertical Band > VerticalHeader.
VerticalHeader and VerticalDetail bands are added.
-
Right-click the DetailReport band again. Click Insert Vertical Band > VerticalTotal.
A VerticalTotal band is added.
You can reduce the width of the bands to save space.
Step 3: Connect the structure to data binding
Do the following:
-
Select the DetailReport band that contains the vertical bands.
-
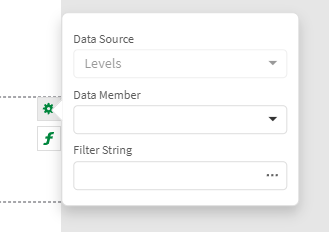
Click the gear icon at the edge of the design surface.
Clicking the gear icon

-
In the menu, select the P&L by Year level as the Data Member.
Tip noteAlternatively, clickat the far right of the designer. Add the Data Member under Detail Report Tasks.
Step 4: Add headers
Do the following:
-
From the toolbox on the left side of the designer, drag three
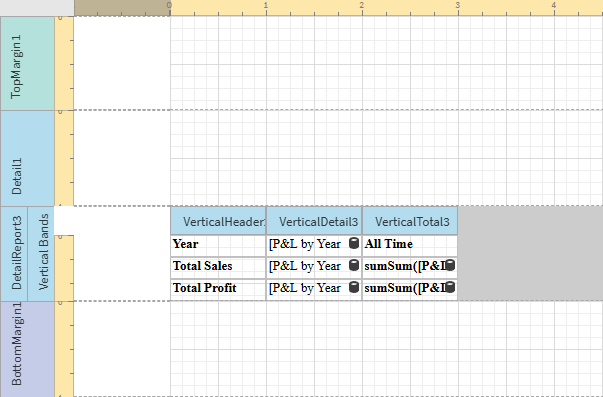
Label objects onto the VerticalHeader1 band, stacking them horizontally as a series of three rows.
-
Double-click each label and give them the following fixed text, respectively:
-
Year
-
Total Sales
-
Total Profit
-
-
From the toolbox on the left side of the designer, drag a
Label object onto the top of VerticalTotal1, arranging it so it is parallel with the Year label. Double-click the label and give it the following fixed text: All Time
Step 5: Add data to template
Do the following:
-
Open the
Field List menu, and expand Levels.
-
Within the P&L by Year level, drag the following fields onto the VerticalDetail1 band, stacking them horizontally as a series of three rows. They should be in this order:
-
OrderYear
-
Sales
-
Profit
-
-
Select the Sales field you just added.
-
Click the gear icon at the edge of the design surface.
-
In the popout menu, click the ellipsis (three dots) menu under Text Format String.
-
The Format String Editor dialog opens. Choose Currency, and adjust the decimal points. Click OK.
-
Repeat this process for the Profit field.
-
Copy the Sales and Profit fields, and paste them onto the VerticalTotal1 band so that the pasted fields are parallel to the original fields.
Step 6: Configure the total calculations
We need to configure the newly pasted Sales and Profit fields to summarize all data from the table columns.
Do the following:
-
Select the Sales field you pasted within the VerticalTotal1 band.
-
Open the
Properties menu from the right-side panel. Expand Data, and then expand Summary.
-
Set Running to Report.
-
Return to the design surface. Click the bold f icon near the selected Sales field to open the Expression Editor.
-
In the Expression Editor, enter the following expression:
sumSum([P&L by Year (P&L by Year_Level).Sales]) -
Repeat this entire process for the Profit field you pasted within the VerticalTotal1 band, but instead use this expression:
sumSum([P&L by Year (P&L by Year_Level).Profit])
Customize font properties in the Properties menu under Appearance > Font.
Report template for profit and loss table

Click Save template, and then click Preview report. Download the report and open it.
Report preview

