A reference line is a line intersecting the chart area from a given point on the measure axis.
For information about how to create reference lines, see Adding reference lines to visualizations.

You can use a reference line to indicate a certain level of chart data. The reference line is only drawn if it falls within the current range of the measure axis. You can have several reference lines in the same chart.
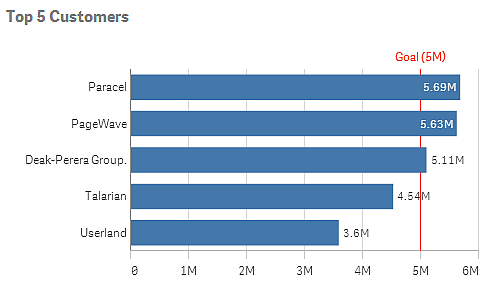
Bar chart Top 5 customers with a reference line at 5M.

Reference lines are available in the following visualization types:
- Bar chart
- Box plot
- Combo chart
- Distribution plot
- Gauge
- Histogram
- Line chart
- Scatter plot
- Waterfall chart
Reference line expression
You can either set the reference line expression to an absolute numeric value, or enter an arbitrary numeric expression.
Dimensional reference lines
You can also add reference lines along the dimension axis. Both continuous and discrete axes are supported. It is possible to enter text values for discrete dimensional axes, and numerical values or expressions for continuous axes. On a time axis it is possible to enter an expression that gives a time-based result like a date or a month.

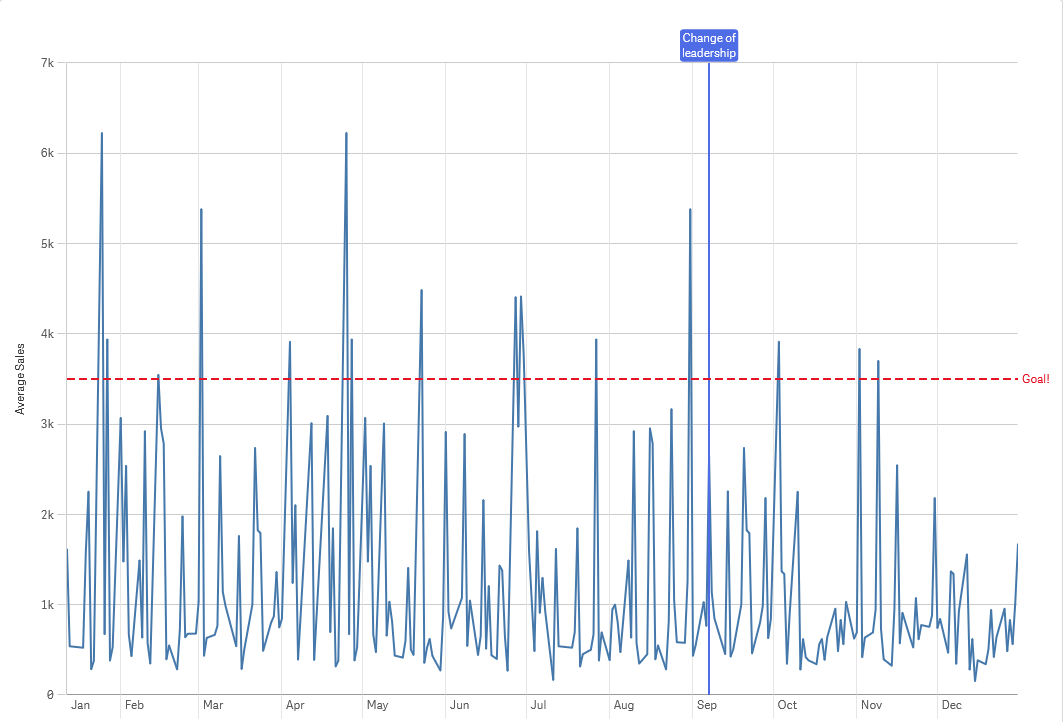
Line chart average sales per month, with a reference line at 3.5k and a dimensional reference line in September.

Dimensional reference lines are available in the following visualization types:
- Bar chart
- Combo chart
- Line chart
