App performance evaluation
Performance evaluation lets you run a tailored evaluation as you develop your app. It provides clear, actionable metrics such as response times for public sheets and objects. You can use these insights to identify performance bottlenecks and compare metrics between app versions.
Who can use performance evaluation
Performance evaluation is designed for app developers who want to measure and improve app performance.
To run a performance evaluation, you must have one of the following roles:
-
Tenant administrator
-
Space owner
-
Space member with one of these roles:
-
Can edit
-
Can edit data in applications
-
Can manage
-
Can operate (in managed spaces)
-
-
All users, including tenant administrators, must have at least view permission in the space to evaluate apps there.
-
Tenant administrators can always view performance evaluation results for all apps, even if they don’t have access permission for the space or app.
Using performance evaluation
You can evaluate the performance of any Qlik Sense app in Qlik Cloud. Use performance evaluation to:
-
Measure your app's performance.
-
Check if changes to your app affected performance.
Performance evaluation analyzes response times for all public sheets and objects in the app. Only published sheets are included, so sheets in development do not affect the results.
Use the results to identify objects that may need optimization. Keep in mind that the results are intended as general guidance and might not reflect exact performance in a live production environment.
Things to consider
-
Performance evaluation runs in a cloud-based environment, so response times may vary due to latency and bandwidth fluctuations.
-
To ensure more consistent comparisons, run evaluations close together in time.
-
Results may be affected if evaluations were run on analytics engines of different sizes.
For more information about performance factors, see Optimizing app performance.
Engine selection for app evaluations
When you run an app performance evaluation in Qlik Cloud, the evaluation runs on a dedicated engine.
By default, evaluations use a 20 GB engine (Standard-20). If your license includes Large app support, evaluations may run on a larger engine (Large-40 to Large-200) when the app requires more memory and the space is configured for large apps.
The engine used in the evaluation is the same size that real users will use when they open the app. This lets you observe performance in the expected runtime environment.
Larger engines typically improve response times, but improvements can also come from app design or optimizations. Comparing results across engine sizes can help you distinguish between capacity effects and app tuning.
Engine sizes
-
Standard-20: Default engine (20 GB)
-
Large-40, Large-60, … Large-200: Larger engines (number indicates GB of memory)
| Engine | Memory | Up to cores* |
|---|---|---|
| Large-40 | 40 GB | 10 cores |
| Large-60 | 60 GB | 14 cores |
| Large-80 | 80 GB | 20 cores |
| Large-120 | 120 GB | 30 cores |
| Large-160 | 160 GB | 40 cores |
| Large-200 | 200 GB | 50 cores |
* “Up to cores” means that resources are provisioned as needed—though not all calculations can use all cores simultaneously.
Capacity usage
-
Running a performance evaluation on a large app uses part of your large app reload capacity, even though the app is not reloaded. Qlik Cloud temporarily provisions a larger engine to perform the evaluation,
-
Opening the app directly to test performance consumes large app consumption capacity for the session, just like normal usage.
For more information about large app capacity, see Large app support.
Running performance evaluations on apps
To run a performance evaluation, you must have reload permission for the app. You can run a performance evaluation from:
-
Your activity centers
-
App details
Running performance evaluations from your activity centers
Do the following:
-
In your activity center, click
on the app you want to evaluate.
-
Select
Evaluate performance.
You will get a notification when the evaluation has completed.
Running performance evaluations from app details
Do the following:
-
In your activity center, click
on the app you want to evaluate.
-
Select
Details, then click
Performance evaluation.
-
Click Evaluate now.
Running performance evaluations from an app
Do the following:
-
In your app, click the app name to open Details.
-
Click
> Evaluate performance.
Viewing evaluation results
Depending on whether you want view a single performance evaluation or compare two performance evaluations, the results tables will differ.
App performance evaluation results are kept for 90 days.
Viewing a single performance evaluation
Do the following:
-
To view the performance evaluation, click
on the app.
-
Select
Details, then click
Performance evaluation. All evaluations are listed in the performance evaluations table.
Tip noteYou can also go to the results by clicking View results in the notification. -
Click View on the evaluation you want to view.
Evaluation overview.
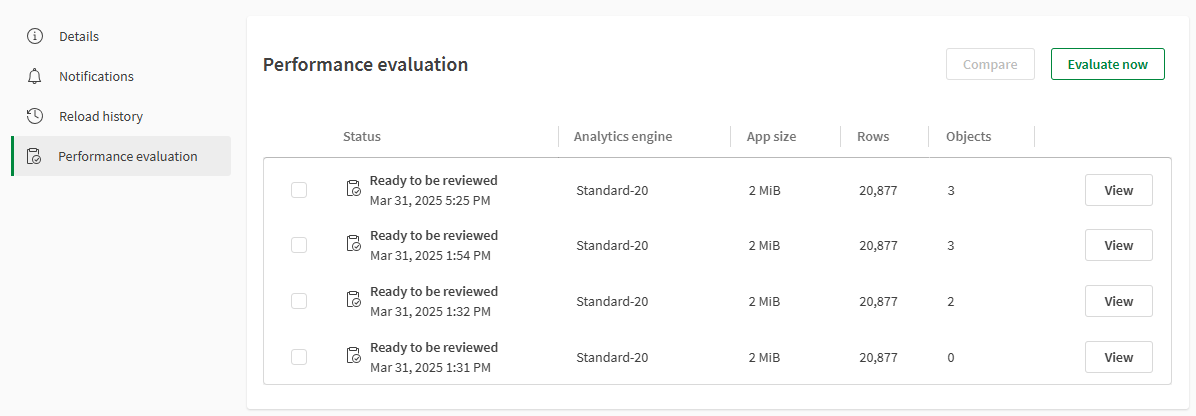
-
The results window provides an information on the performance evaluation results.
Tip noteSee Performance evaluation information for details on the specific metrics.Evaluation information tab.
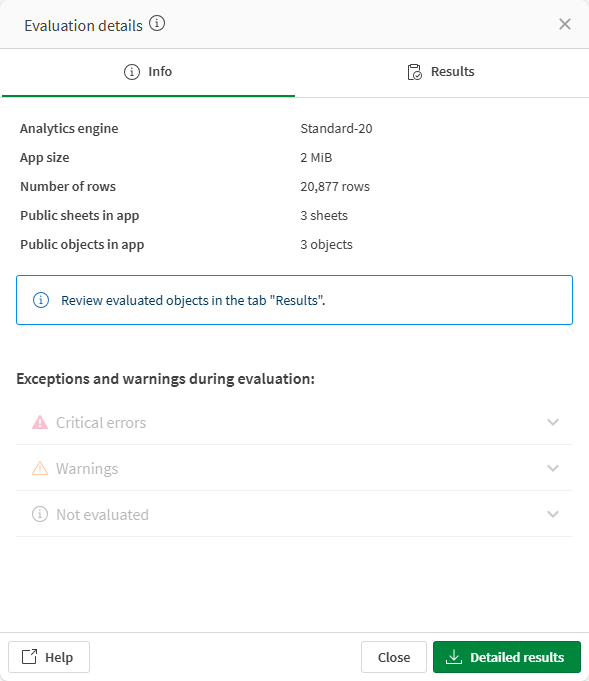
-
Select the Results tab to view more specific performance information.
Evaluation results tab.
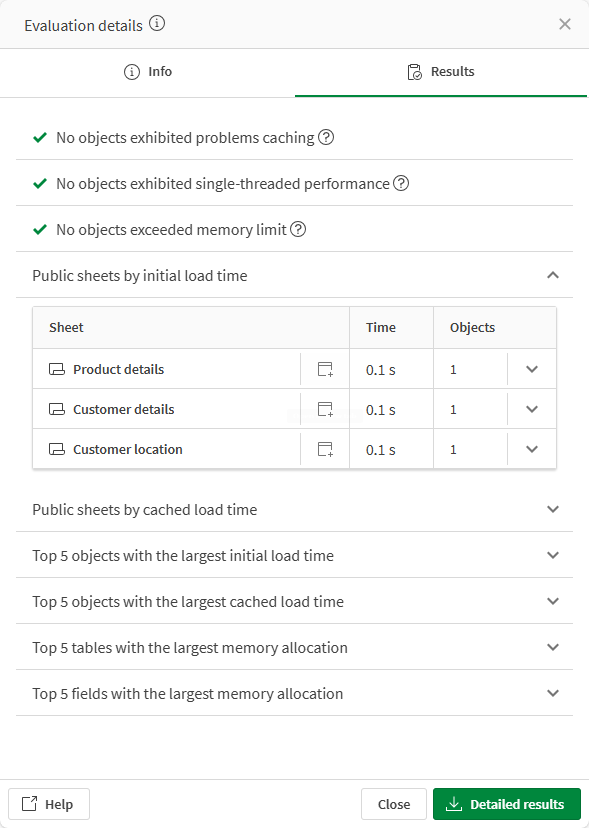
-
Click
to show the details for each row. You can also click
for each sheet to show the objects with longest load time.
-
Click
to open the app containing the object. The specific object is highlighted on the sheet.
Comparing performance evaluations
Do the following:
-
To view the performance evaluation, click
on the app.
-
Select
Details, then click
Performance evaluation. All evaluations are listed in the performance evaluations table.
-
Select the two you want to view, then click Compare.
Comparing two evaluations.
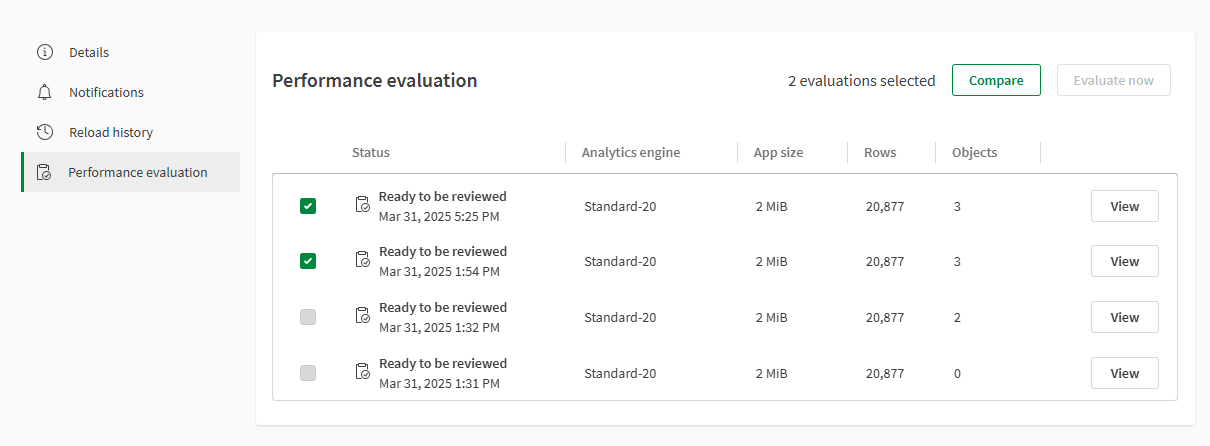
-
The evaluation results open in a window. See Performance evaluation information for details on the specific metrics. The Info tab shows the metrics for the selected performance evaluation, in addition to the difference between them.
Evaluation comparison information.
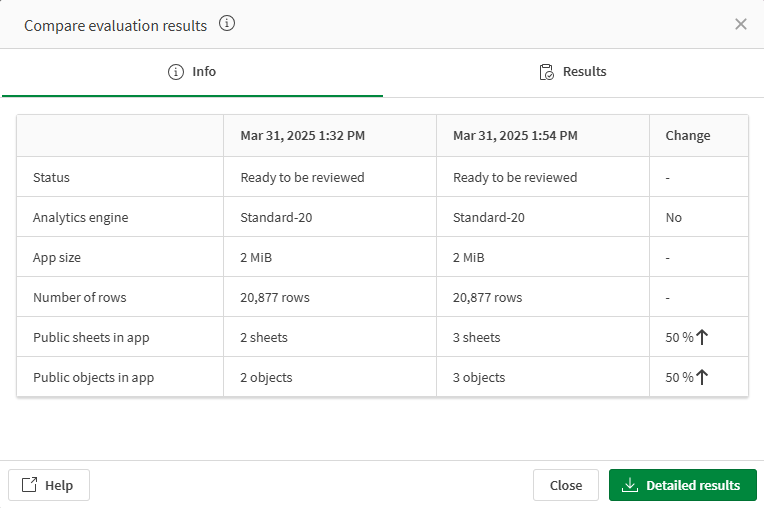
-
Select the Results tab to view more specific performance information. For each row, the absolute and relative change is shown.
You can sort on the Absolute change and Relative change columns. Click on the column heading to sort in ascending or descending order.
Evaluation comparison results.
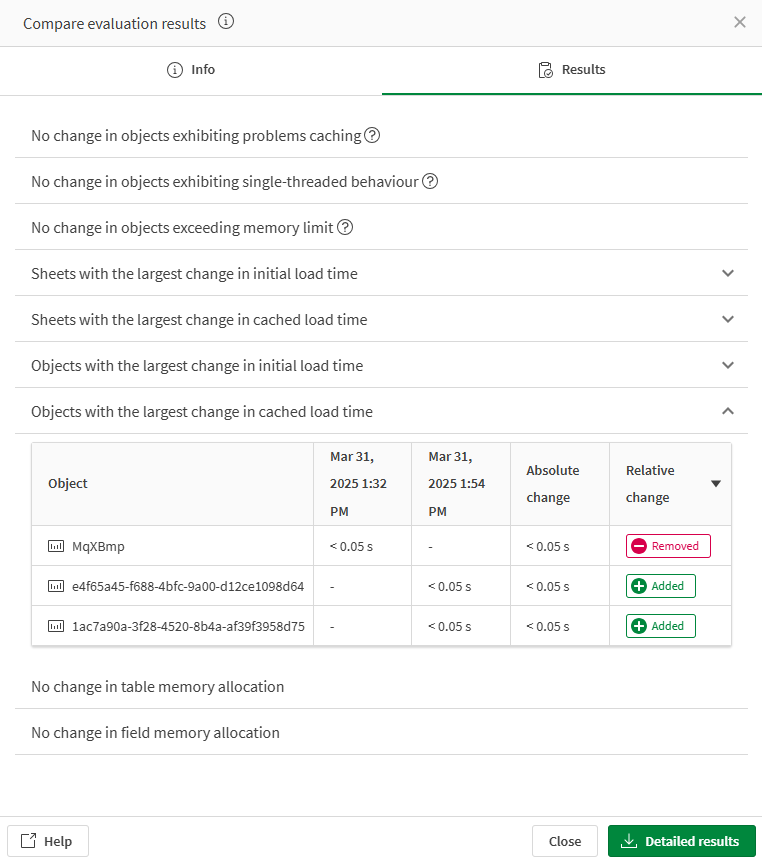
-
Click
to show the details for each row.
Performance evaluation information
The metrics are obtained either from the app metadata, or they are measured during the performance evaluation.
Info tab
The Info tab shows basic app information for the selected version.
Analytics engine
-
Shows the analytics engine used during the evaluation.
Information noteIf large app support is enabled, a larger engine may be used instead of the Standard-20 engine.
Status
-
Shows the status of the performance evaluation.
-
Ready for to be reviewed - the performance evaluation completed successfully.
-
Warning - the performance evaluation completed but some results are missing or inaccurate.
-
Failed to evaluate - the performance evaluation did not complete successfully and results are missing or inaccurate.
-
App size
-
Source of metric: App metadata
-
Shows the total size of the app data model in-memory with no initial selections.
Number of rows
-
Source of metric: App metadata
-
Shows the total rows in contained in tables in the data model of the app.
Public sheets in app
-
Source of metric: App metadata
-
Shows the total public sheets in the app.
Public objects in app
-
Source of metric: App metadata
-
Shows the total public objects in the app.
Information noteIn the performance evaluation results, the public sheets are not counted as public objects.
Not evaluated
-
Source of metric: Measured
-
Lists all objects that could not be completely evaluated. Typical reasons may include if the object has a calculation condition that has not been met or if the object type is not supported for evaluation. For example, customer-developed extension behavior is not known to the app evaluator and may not be evaluated correctly.
Warnings
-
Source of metric: Measured
-
Lists objects that have issues related to app development, which might need to be addressed. For example, a object that functions in a sheet but has error codes, such as an object that does not have measures or dimensions, is listed under Warnings. If an object sends back a data page over a specified size that will also be listed here with Payload too large.
Critical Errors
-
Source of metric: Measured
-
Lists errors that stopped the evaluation from completing, along with tenant or app quotas. This may include app evaluator errors or other infrastructure issues that prevent completion, such as if the quota for app evaluation is exceeded or if the app exceeds the app evaluation size limit of 20 GB and cannot be opened.
Results tab
The Results tab provides more specific information about the performance evaluation.
Object exhibiting problems caching
-
Source of metric: Measured
-
Lists objects are not being cached efficiently. This is determined by loading each object twice. After having already loaded the object once, a faster response time can be expected because the result set should be entered into the cache. Improvements can potentially be made by adjusting the data model or expressions. For more information, see best practices for data modeling and using expressions in visualizations.
-
For more information about general app optimization, see Optimizing app performance.
Single-threaded objects
-
Source of metric: Measured
-
This section contains objects whose performance metrics indicate predominantly single-threaded processing during loading. If an object appears in this section and the response time for a user is deemed too long, the queries resulting from any expressions in the object should be reviewed for bottlenecks. Improvements can potentially be made by adjusting the data model or expressions.
-
For more information about single-threaded performance, see Fields from different tables inside an aggregation table are avoided where possible.
Objects exceeding memory limit
-
Source of metric: Measured
-
This section contains objects that have reached a memory limit, with a corresponding error code. These may include objects that reach an engine object sandboxing limit, exceeded total engine memory, or reached a related memory boundary.
Public sheets by initial load time
-
Source of metric: Measured
-
Measurement of response time per sheet. These measurements are extracted from the first time the app is traversed and each of the sheets are being requested one by one. The values contained within this section represent a worst-case load time per sheet. For each sheet, it is possible to view the top 5 slowest objects contained therein by clicking the arrow icon to the right of the row. This gives you a quick breakdown of where time is being spent while loading the sheet.
-
If the evaluation stops due to a timeout, the list of sheets is available as long as at least one sheet evaluation was completed. You can use this list to identify which sheets or objects to investigate first.
Cached sheet load time
-
Source of metric: Measured
-
Measurement of response time per sheet. When all sheets were requested the first time they should typically have been cached. These measurements are extracted from the second time the app is traversed and each of the sheets are being requested one by one. Also here, you can retrieve a breakdown of where time is being spent on an object-basis by expanding a row using the button to the right.
Initial object load time
-
Source of metric: Measured
-
Measurement of response time per object. These measurements are extracted from the first time the app is traversed and each of the objects are being requested one by one. The values contained within this section represent a worst-case load time per object.
-
For example, you can improve the use of caching by using master items. For more information, see Master items or variablesused for expressions.
Cached object load time
-
Source of metric: Measured
-
Measurement of response time per object. When all objects were requested the first time they should typically have been cached. These measurements are extracted from the second time the app is traversed and each of the objects are being requested one by one.
Memory allocation per table
-
Source of metric: App metadata
-
A list of tables included in the data model and the size thereof. This section will be of interest when attempting to minimize the size of the data model, which translates to improved responsiveness.
-
You can drop fields and tables that are not used in any expression in the load script to improve speed and resource usage. For more information, see Data model performance.
Memory allocation per field
-
Source of metric: App metadata
-
A list of fields included in the data model and the size thereof. This section will be of interest when attempting to minimize the size of the data model, which translates to improved responsiveness.
-
You can drop fields and tables that are not used in any expression in the load script to improve speed and resource usage. For more information, see Data model performance.
Notification preferences
You can choose to be notified when performance evaluation has completed or failed.
Click on the app and select Notifications. The following notifications for performance evaluations are available:
-
Performance evaluation for this app is ready to be reviewed
-
Performance evaluation for this app has failed to run
Limitations
-
Only public sheets in the app, including all objects on them, are evaluated.
-
Handling evaluation timeouts
If an app has many objects or is very large, a performance evaluation may time out. A timeout does not mean the evaluation failed completely. Even if it stops early, you can still review the slowest sheets and objects that were evaluated up to that point. Use this list to investigate performance issues.
To reduce the risk of a timeout:
-
Make irrelevant sheets private before running the evaluation.
-
For published apps, you can duplicate the app and publish a copy with fewer public sheets.
Timeouts and memory warnings are normal for complex apps. They indicate areas where optimization, less data, or a larger engine may improve performance.
-
-
Not all chart objects are supported. If an object is not supported, it is mentioned in the Not evaluated section of the results.
-
Chart objects created from chart suggestions prior to June 2020 need to be manually updated to be supported.
-
If the app uses section access to reduce data, the evaluation is performed with data reduced for the current user. This means you need to run the evaluation as a user with access to the data set that you want to evaluate. It is not relevant to compare results from users with different section access.
-
Default case (no large app support): The app performance evaluation is limited to 20 GB engine capacity. Apps requiring more memory will fail the evaluation with an error message.
-
With large app support: If you have purchased large app support, you can evaluate apps up to 50 GB using engines with higher capacities. For more information about supported app sizes, see Large app support.
-
Write tables are not supported in app performance evaluation.
