Making selections is the main interaction method in Qlik Sense. Selections filter out a subset of the data that is loaded into Qlik Sense. You use selections to focus on something you want to know more about. Qlik Sense responds by color coding values according to their different states.
You can think of your selections as an input for Qlik Sense. Qlik Sense evaluates the input and displays the color codes on data values as the output.
- The input state: the selection that you have made – whether the field value is selected or not.
- The output state: whether the field value is possible or not, given the logical inference of the selection.
Selection states
When you make selections, the colors of the values change accordingly. Color-coding is used in filter panes, selections list items, and the selections tool, with the characteristic Qlik Sense colors green, white, and gray. The colors bring you information about which field values are selected, alternative, possible and excluded, respectively.
The following table lists which colors are used for the different states.
The colors used in the selection bar, and for each selection state, can be modified with a custom theme. If you are working with an app that uses a custom theme, you might notice that your selections do not display with the same colors that are described in this help topic.
| Color | State |
|---|---|
| Green, with a check mark as a selection indicator | Selected |
| White | Possible |
| Light gray | Alternative |
| Dark gray | Excluded |
| Dark gray with a check mark as a selection indicator | Selected excluded |
The selected state
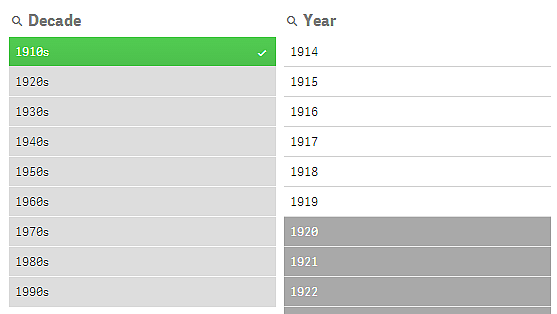
When you select one or more values in a filter pane and the values turn green, they are in the selected state. In the following image, the value 1910s has been selected. The selection filters out a subset of the data that is loaded, and the filter panes Decade and Year are updated according to the selection.
1910s in the Decade filter pane has been selected.

The filter panes have four states altogether. Apart from the selected state (green), there are possible values (white), light gray values (alternative), and dark gray values (excluded). These states are explained in the following sections.
The possible state
In the Year filter pane, the years 1914 up to 1919 are white (possible), because these values are all years from the 1910s, the selected value in Decade. All possible values are 'associated' with the value 1910. You could refine your selection by selecting one or more of the possible values.
1914 to 1919 in the Year filter pane are possible values.

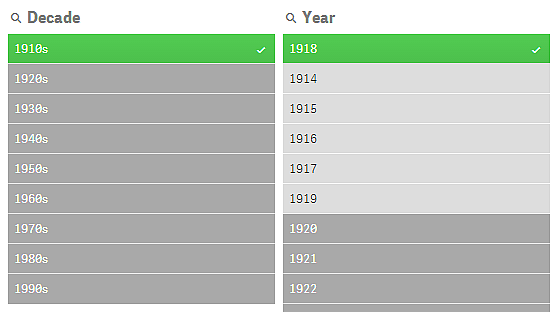
In the following image, such a refinement has been made. The value 1918 has been selected in the Year filter pane.
1918 has been selected in the Year filter pane.

With selections in two filter panes, the possible values are only those that are associated both with 1910s and 1918. There is a logical AND condition between selections from different filter panes. A possible value must then be associated both with 1910s and 1918.
In the Year filter pane, there are no longer any values in the state possible, because none of the values are associated with both 1910s and 1918.
The alternative state
In the Decade filter pane, the value 1910s has been selected, and all the other fields in the filter panes have a certain state, depending on their relationship to the selected value.
1910s has been selected and all other fields in the filter panes have different states depending on their relationship with 1910s.

All the other values in the filter pane Decade are light gray, meaning that they are alternative values. The alternative state is used for values that would have been possible if a selection had not already been made in that field. Before 1910s was selected, all the values in the filter pane Decade were possible values.
Logically, the alternative values are excluded, but they are only excluded by a single selection (of one or more values), in the same filter pane. If you would clear the selection of 1910s in Decade, all the values would have the state possible.
Even if a value is alternative, you can still select it, but that means that you are, partly, making a new selection rather than refining your original selection. What is useful with alternative values is that you know that there are alternatives available for the same set of selections. If you have a list of sales persons, the alternative values constitute sales persons that may be able to help or replace the selected person.
The excluded state
When a selection is made, values in other filter panes may automatically be excluded, because they are not associated. In the following image, 1910s has been selected, and as a consequence the values 1920, 1921, and 1922 have been excluded. This is an obvious exclusion, because the years 1920, 1921, and 1922 are not part of the 1910s. The other values in Decade are alternative, that is, they are excluded but you can still select them and thereby expand the selection. If you were to select 1920s the value would turn green and have the state selected.
1920, 1921, and 1922 in the Year filter pane have been excluded.

But if you select one of the possible values in the filter pane Year, all the values in Decade that were alternative become excluded instead. When only 1910s was selected they were alternative, but with selections in two filter panes, values that do not match the condition 1910sAND1918 are excluded.
The values that are alternative in Year are only excluded by the selection 1918. They are all associated with the value 1910s and had the state possible until 1918 was selected.

The selected excluded state
When you make selections in more than one filter pane, you might run into a fifth state: selected excluded.
As mentioned previously, there are two different states for each field value:
- The input state: the selection that you have made – whether the field value is selected or not.
- The output state: whether the field value is possible or not, given the logical inference of the selection.
A value enters the selected excluded state because the value was first selected, and then excluded by a selection in another field.
For the selected excluded state, the check mark is an indicator that the value was first selected and then excluded, in contrast to excluded values that have never been selected. A dark gray field with a check mark indicates that the value was previously a selected value, but a new selection has then rendered it selected excluded.
Example:
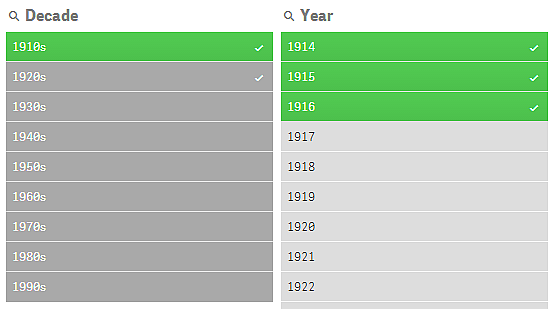
In the following image, the first selection was of the values 1910s and 1920s. The values 1910s and 1920s were both selected (green) and all the values in the filter pane Year were white (possible), since they are all years from the 1910s or 1920s and therefore logically possible values after the first selection. The second selection is of the years 1914, 1915, and 1916. Now, 1920s is no longer a part of the active selection, since the second selection logically excludes 1920s. However, 1920s is still a selected value and therefore it makes sense to denote it as a value that is selected excluded. It was originally selected, but a later selection excluded it. The check mark distinguishes it from the excluded values that have never been selected.
The dark gray value with a check mark is selected excluded.

