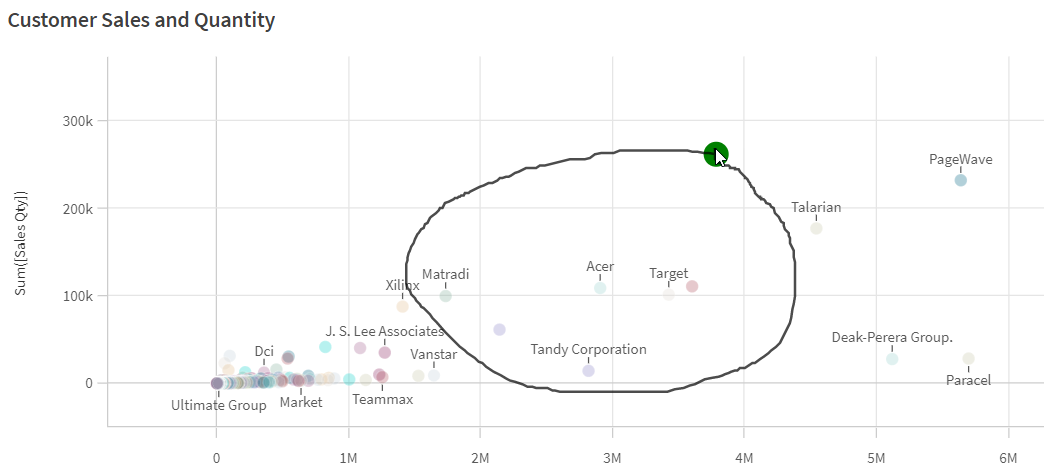
You can drag to pan and scroll in visualizations and then turn on lasso selection to draw and select.
When working with visualizations, you often need to scroll to find the data you are looking for.
Scatter plot with selections made with lasso selection.

Using lasso selection with scrolling
Do the following:
-
Press Shift and draw to make a selection.
You can make consecutive selections. Lasso selection is turned on for as long as Shift is pressed.
-
Confirm the selection.
Alternative procedure
Do the following:
-
Click inside the visualization without making a selection.
Selection options are displayed at the top of the visualization.
- Click
to turn on lasso selection.
-
Make and confirm the selection.
You can click to turn lasso selection on and off if you need to scroll and pan between selections.
Visualizations where lasso selection needs to be enabled
In the following visualizations you need to activate lasso selection:
- Bar chart
- Box plot
- Combo chart
- Distribution plot
- Line chart
- Map
- Pie chart
- Scatter plot
- Treemap
