Which aggregation functions?
Aggregation functions are many-to-one functions. They use the values from many records as input and collapse these into one single value that summarizes all records. Sum(), Count(), Avg(), Min(), and Only() are all aggregation functions.
In Qlik Sense, you need exactly one level of aggregation function in most formulas. This includes chart expressions, text boxes, and labels. If you do not include an aggregation function in your expression, Qlik Sense will automatically assign the Only() function.
- An aggregation function is a function that returns a single value describing some property of several records in your data.
- All expressions, except calculated dimensions, are evaluated as aggregations.
- All field references in expressions must be wrapped in an aggregation function.
Consolidating amounts using Sum()
Sum() calculates the total of the values given by the expression or field across the aggregated data.
Let us calculate the total sales that each manager has made, as well at the total sales of all managers.
Inside the app on the Which Aggregations? sheet you will find two tables, a table titled Sum(), Max(), Min(), and a table titled Count(). We will use each table to create aggregation functions.
Do the following:
- Select the available Sum(), Max(), Min() table.
The properties panel opens. - Click Add column and select Measure.
- Click on the
symbol.
The expression editor opens. - Enter the following: Sum(Sales)
- Click Apply.
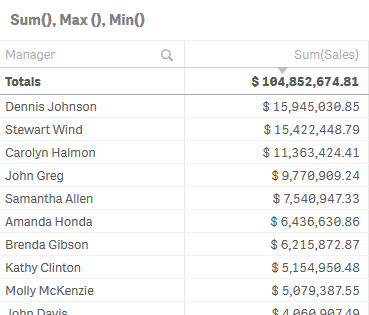
You can see the sales that each manager has made, as well as the total sales of all managers.
For more information see Sum.
Calculating highest sale value using Max()
Max() finds the highest value per row in the aggregated data.
Do the following:
- Click Add column and select Measure.
- Click on the
symbol.
The expression editor opens. - Enter the following : Max (Sales)
- Click Apply.
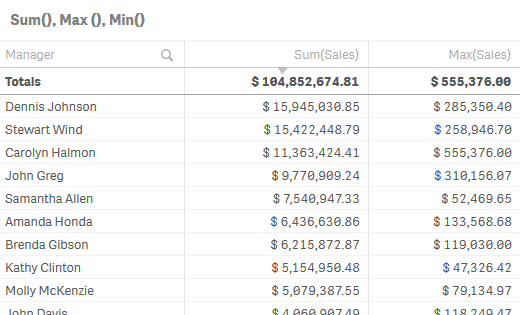
You can see that the highest sales earnings for each manager, as well as the highest total number.
For more information, see Max.
Calculating lowest sale value using Min()
Min() finds the lowest value per row, in the aggregated data.
Do the following:
- Click Add column and select Measure.
- Click on the
symbol.
The expression editor opens. - Enter the following : Min (Sales)
- Click Apply.
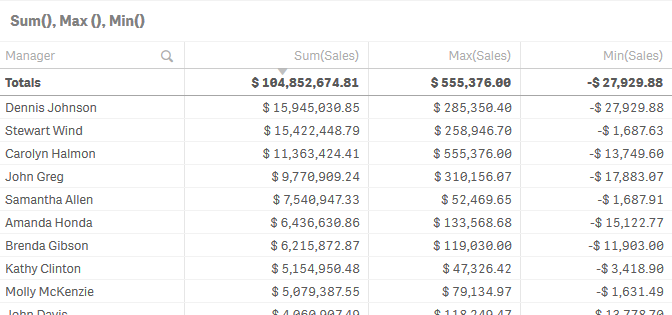
You can see the lowest sales earnings for each manager, as well as the lowest total number.
For more information see Min.
Counting the number of entities using Count()
Count() is used to count the number of values, text and numeric, in each chart dimension.
In our data, each manager is responsible for a number of sales representatives (Sales Rep Name). Let us calculate the number of sales representatives.
Do the following:
- Select the available Count() table.
The properties panel opens. - Click Add column and select Measure.
- Click on the
symbol.
The expression editor opens. - Enter the following : Count([Sales Rep Name])
- Click Apply.
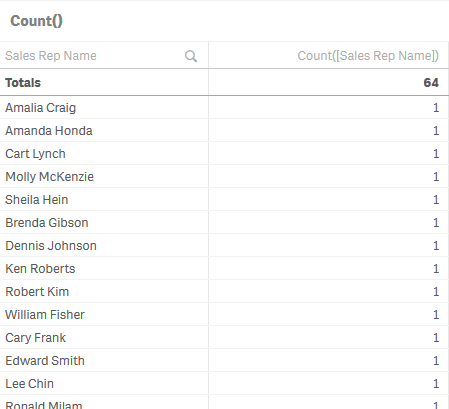
You can see that the total number of sales representatives is 64.
Difference between Count()and Count(distinct )
Let us calculate the number of managers.
Do the following:
- Add a new dimension to your table: Manager.
A single manager is handling more than one sales representative, so the same manager name appears more than once in the table. - Click Add column and select Measure.
- Click on the
symbol.
The expression editor opens. - Enter the following: Count(Manager)
-
Add another measure with the expression: Count(distinct Manager)
- Click Apply.
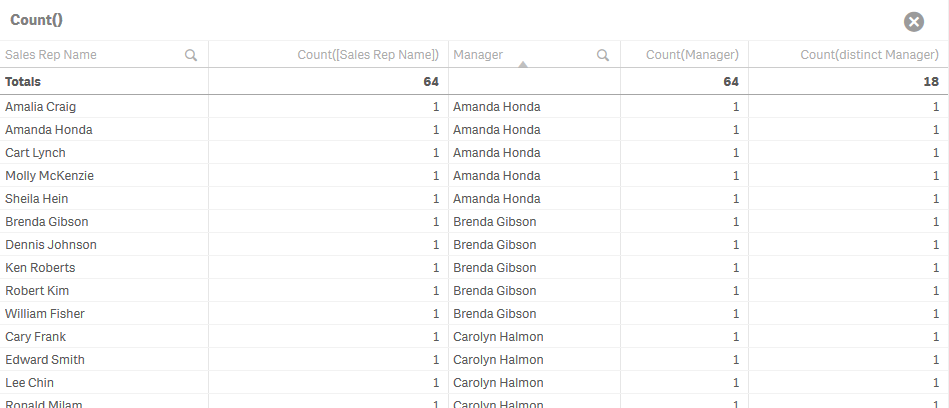
You can see that the total number of managers on the column using Count(Manager) as an expression was calculated as 64. That is not correct. The total number of managers is correctly calculated as 18 using the Count(distinct Manager) expression. Each manager is only counted once, regardless of how many times their name appears on the list.
For more information see Count.
