Point layers
A point layer overlays individual locations on a map, representing them with shapes.

By default, point layers use circular bubbles, but you can also use several other shapes. You can also use custom images as the points in a point layer. The size of the points in your layer can be fixed or you can specify a measure or expression to set the sizes of the different points. You can highlight these differences in values further by coloring by measure.
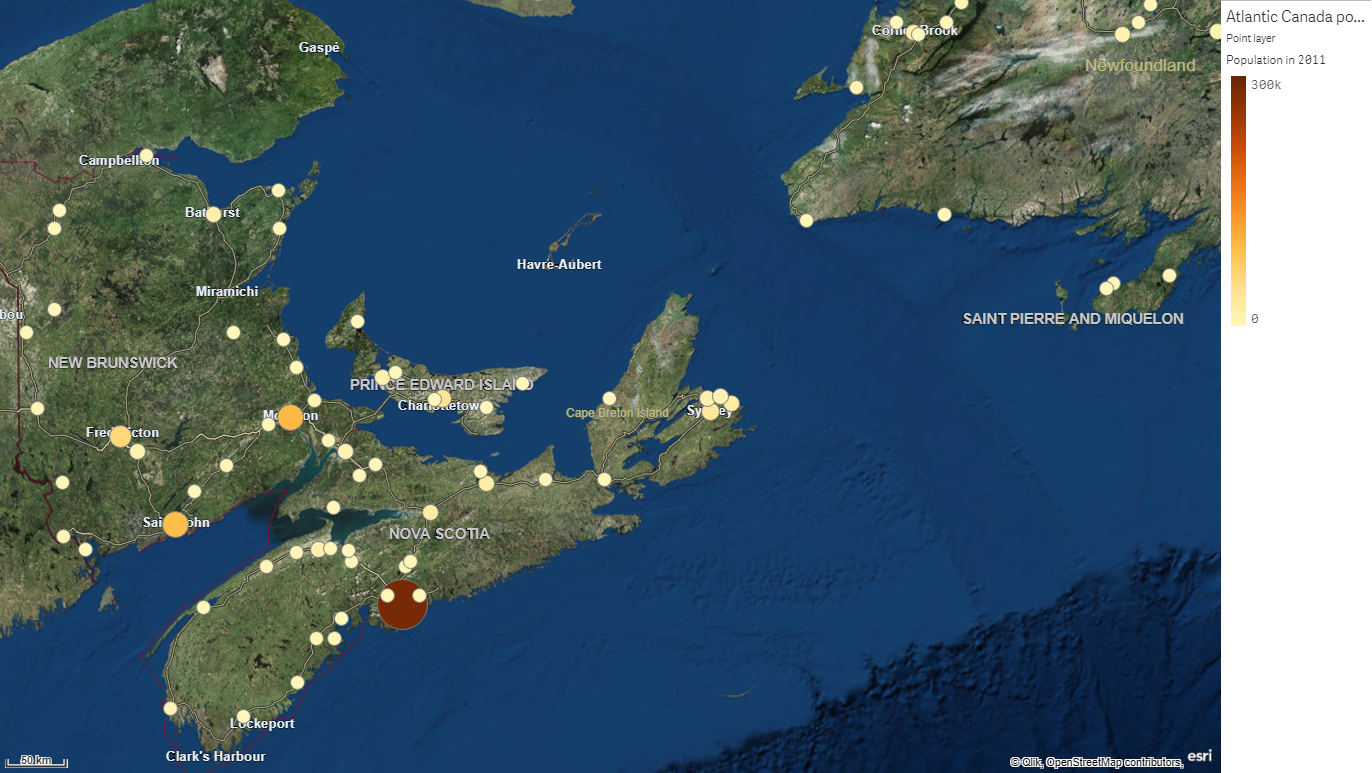
Map with point layer displaying cities in Atlantic Canada colored and sized by population.

Adding a point layer
Do the following:
- From Layers in the properties panel, click Add layer and select Point layer.
- In Dimensions, click Add and select a field containing point data to use as the dimension.
-
If there are issues with the point locations, adjust the location settings in Locations in the properties panel.
For more information, see Map chart.
-
Optionally, in Options > General, after Max visible objects, set the maximum locations to display in the layer.
The maximum number of values in a map layer is 50,000. By default, layers display a maximum of 4,000 values for point layers and 1,000 for other layers.
Once the layer is added, you can adjust settings for the layer in the properties panel.
