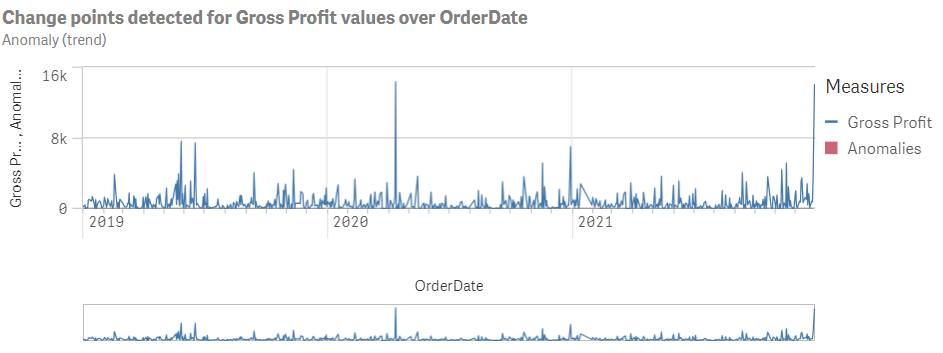
Anomaly (trend) analysis
Detect and show abrupt data variations, including change points between time series segments.
Change point detection identifies moments in time when the underlying process generating the data experiences significant changes. These can include sudden changes in the baseline or trends in the data. It may also include shifts in the magnitude of noise distribution in the data.
The combo chart created by Anomaly (trend) tracks the measure with lines. The bars display possible change point anomalies.
Anomaly (trend) analysis

Creating anomaly (trend) analyses
Do the following:
-
In Assets, click Analysis.
-
Drag and drop Anomaly (trend) into the sheet.
-
Click Add dimension and select a temporal dimension.
-
Click Add measure and select a measure.
-
Optionally, in the properties panel, under Appearance, adjust the appearance of the analysis.
