Mutual information analysis
Detect and show key driver analysis between the a field and potential driver fields.
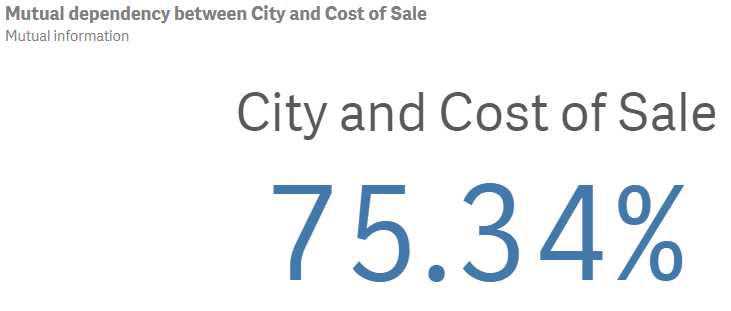
Mutual information shows the statistical measurement of the dependency between a target (the first selected dimension) and up to 10 other fields.
Mutual information analyses creates a measure of certainty between pairs of values using a machine learning algorithm that applies random data distributions.
Mutual information selects one field (measure or dimension) as the target and then selects 1 to 10 dimensions or measures as drivers. Results for this analysis type for the same fields or selections might vary due to the random data selection.
The dependency indicator ranges between 0 percent (no dependency) and 100 percent(strong dependency).
Mutual information analysis

Mutual information does not necessarily indicate causality between fields sharing mutual information. Two fields may share mutual information, but may not be equal drivers for one another. For example, when comparing ice cream sales and outdoor temperature, a mutual information analysis will show mutual information between the two. It will not indicate if it is outdoor temperature driving ice cream sales, which is likely, or if it is ice cream sales that drives outdoor temperature, which is unlikely.
Creating mutual information analyses
Do the following:
-
In Assets, click Analysis.
-
Drag and drop Mutual information into the sheet.
-
Click Add dimension and select a target field for mutual information analysis.
-
Click Add dimension and a select a second field as the driver for mutual information analysis.
-
Optionally, add additional drivers. In the properties panel, under Data, click Add and select another dimension.
You may have a total of 10 drivers.
-
Optionally, in the properties panel, under Appearance, adjust the appearance of the analysis.
