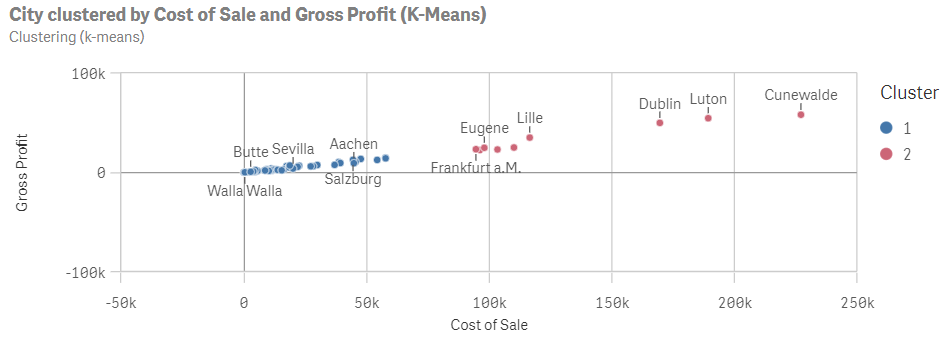
Clustering (k-means) analysis
Show clusters of measures associated with a dimension using a statistical algorithm.
Clustering (k-means) clusters data points aggregated by similarities from two measures over a dimension using a machine learning k-means algorithm.
Clustering (k-means) analysis

Creating clustering (k-means) analysis
Do the following:
-
In Assets, click Analysis.
-
Drag and drop Clustering (k-means) into the sheet.
-
Click Add dimension and select a dimension.
-
Click Add measure and select a measure.
-
Click Add measure and select a second measure.
-
Optimally, to customize the clusters, do the following:
-
In the properties panel, in Analysis properties, change Clusters from Auto to Custom.
-
After Number of clusters, adjust the slider to set the clusters.
-
After Normalization algorithm, select the algorithm to use. The following are available:
-
zscore: Z-score normalization normalizes data based on feature mean and standard deviation. Z-score does not ensure each feature has the same scale but it is a better approach than min-max when dealing with outliers.
-
minmax: Min-max normalization ensures that the features have the same scale by taking the minimum and maximum values of each and recalculating each datapoint.
-
none: No normalization.
-
-
-
Optionally, to add an analysis period, do the following:
-
In the properties panel, under Analysis properties, turn on Analysis period.
-
Under Calendar period, select the calendar period to use.
-
Under Period, select a specific period to use.
Information noteAnalysis periods requires calendar periods in the logical model. For more information, see Defining analysis periods with calendar periods. -
-
Optionally, in the properties panel, under Appearance, adjust the appearance of the analysis.
