Customizing fields and groups
The next step to customizing your logical model is to define your fields and groups. Fields and groups are the basic level of the logical model. All other logical model elements use these groups.
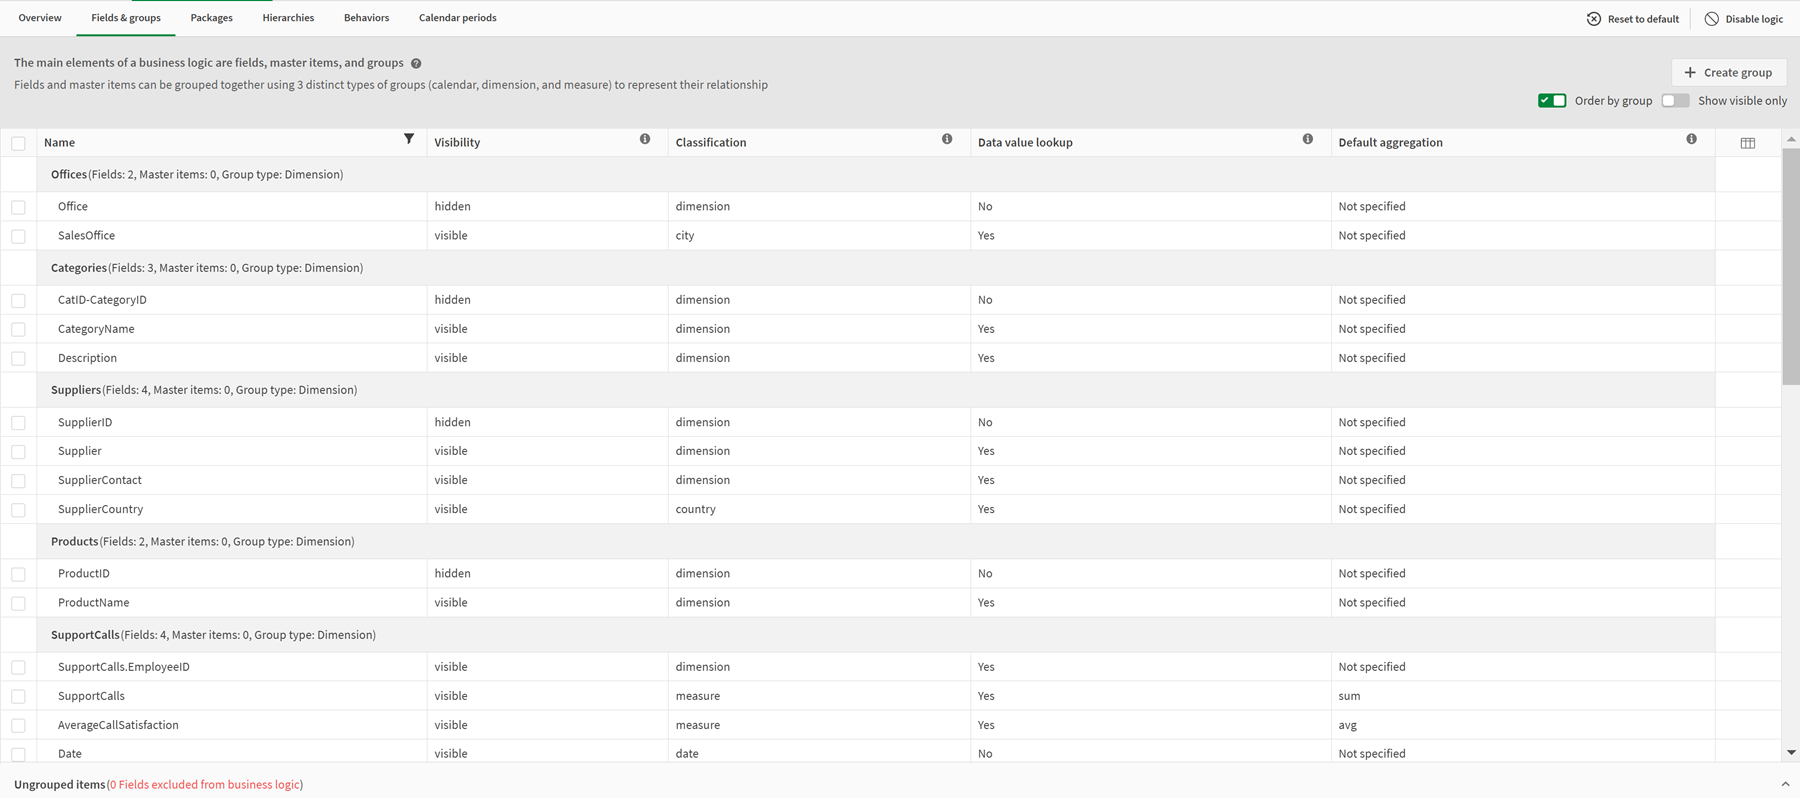
When you enable a custom logical model, Qlik Sense automatically creates default groups from your data model. It also sets the properties of all your fields. Some of these groups and field properties need to be adjusted. Qlik Sense will make a best interpretation of your data model, but it is not always correct in which fields should be hidden or which fields are measures, for example.
Fields & groups, with default groups

There are three kinds of groups:
-
Dimension: A dimension group consists of related fields that are classified as dimensions. Dimension groups can also contain fields classified as measures or dates.
-
Measure: A measure group consists of related measure fields. Only measures can belong to a measure group.
-
Calendar: A calendar group contains a time dimension in your logical model. Calendar groups can only contain dimensions and must have at least one temporal fields (such as date, timestamp, or year).
Each group has field with the following properties:
-
Visibility: Defines if a field is visible or not in Insight Advisor. Hidden fields can still be used in analysis, such as when a user searches for that field.
-
Classification: Defines the default role the field plays in analysis. Classifications can be broad, such as dimension, or specific, such as city.
-
Data value lookup: Controls whether or not users can search for specific values from this field. Reducing the number of fields that have data value lookup enabled can help you avoid false positive results and reduce the time to generate results.
-
Default aggregation: Sets the standard aggregation for measures in Insight Advisor. When a field has a default aggregation, Insight Advisor always applies that aggregation when using it as a measure. Users can edit Insight Advisor analyses to change the aggregation to a different type in Insight Advisor.
-
Favorable trend: Defines whether the favorable trend is for the measure is to go up or down.
-
Overall aggregation: Defines which aggregation should be used when Insight Advisor cannot determine for itself what aggregation to use when generating results involving master measures with complex expressions. You can only set overall aggregation for master measures.
-
Favorite: Defines a measure that should be used more often in analysis when Insight Advisor generates analyses without a question or field selections, such as with Generate.
-
Default period grain: Sets a default grain to use with a date field in analyses.
You can set which columns display in the table by clicking .
Fields can be ungrouped. Ungrouped fields belong to no group and are excluded from analysis.
Why define fields and groups?
Defining fields and groups enables you to set the defaults of how fields and master items are handled. When you define fields, you set the preferences on how they are handled by Insight Advisor. For example:
-
Should this field be available for analysis in Insight Advisor?
-
Should this field be used as a dimension or measure? What kind of dimension or measure?
-
Can Insight Advisor look up individual values from the field in searches?
-
What should the default aggregation for the field be when used as a measure?
When you define groups, you show Insight Advisor which fields are closely related and should be used together in analysis. Groups are used to create other business logic features, such as packages, calendar periods, and behaviors.
Customizing your fields and groups
You are going to start by cleaning up some of the field properties to change visibility and adjust a few classifications. You are then going to ungroup some of the fields from the groups. With these fields, you will make the following new groups:
-
Customer
-
SalesCity
-
SalesCountry
-
SupportCalls
-
SupportDate
Some fields you will leave ungrouped. Ungrouped fields are not used by Insight Advisor in any analysis. This will remove fields that are not relevant to analysis, such as ID and GeoInfo fields.
Customizing field properties
Do the following:
-
Navigate to Fields & groups.
-
In Employees, adjust the following fields:
-
For Extension, set the following properties:
- Visibility: visible
-
Classification: dimension
-
Data value lookup: No
-
Default aggregation: Not specified
-
For EmployeeName, set the following properties:
-
Visibility: visible
-
Classification: dimension
-
Data value lookup: Yes
-
Default aggregation: Not specified
-
-
For Hire Date, set the following properties:
-
Visibility: visible
-
-
For Reports To, set the following properties:
-
Visibility: hidden
-
Classification: dimension
-
Data value lookup: Yes
-
Default aggregation: Not specified
-
-
For Title, set the following properties:
-
Visibility: visible
-
-
For Year Salary, set the following properties:
-
Visibility: visible
-
Classification: monetary
-
Data value lookup: No
-
Default aggregation: Sum
-
-
Ungrouping fields
Do the following:
-
In Categories, select CatID-CategoryID.
-
In Suppliers, select SupplierID .
-
In SupportCalls, select the following:
-
SupportCalls
-
AverageCallSatisfaction
-
Date
-
-
In Products, select ProductID.
-
In Employees, select EmployeeID.
-
In Sales_ENT, select the following fields:
-
Address
-
City
-
ContactName
-
Country
-
CountryCode
-
Customer
-
CustomerID
-
Latitude
-
Longitude
-
Longitude_Latitude
-
OrderID
-
Phone
-
PostalCode
-
ShipperID
-
-
Click Ungroup.
Creating Customer group
This group will let you group together dimension fields relating to customer information.
Do the following:
-
Click Create group.
-
For Group name, enter Customer.
-
For Group type, select Dimension.
-
Add the following fields to the group:
-
Address
-
ContactName
-
Customer
-
Phone
-
PostalCode
-
-
Click Create.
Creating SalesCity group
This group will let you group together dimension fields relating to city information. You will use this later when making a hierarchy.
Do the following:
-
Click Create group.
-
For Group name, enter SalesCity.
-
For Group type, select Dimension.
-
Add the following fields to the group:
-
City
-
Longitude_Latitude
-
-
Click Create.
Creating SalesCountry group
This group will let you group together dimension fields relating to country information. You will use this later when making a hierarchy.
Do the following:
-
Click Create group.
-
For Group name, enter SalesCountry.
-
For Group type, select Dimension.
-
Add the followings fields to the group:
-
Country
-
CountryCode
-
-
Click Create.
Creating SupportCalls group
You removed all fields from the previous SupportCalls group as it was classified as a dimension group. You will use the fields to make a measure group.
Do the following:
-
Click Create group.
-
For Group name, enter SupportCalls.
-
For Group type, select Measure.
-
Add the following fields to the group:
-
AverageCallSatisfaction
-
SupportCalls
-
-
Click Create.
Creating SupportDate group
Finally, you will make a calendar group for the Date field from the support calls data.
Do the following:
-
Click Create group.
-
For Group name, enter SupportDate.
-
For Group type, select Calendar.
-
Add the following fields to the group:
-
Date
-
-
Click Create.
Results
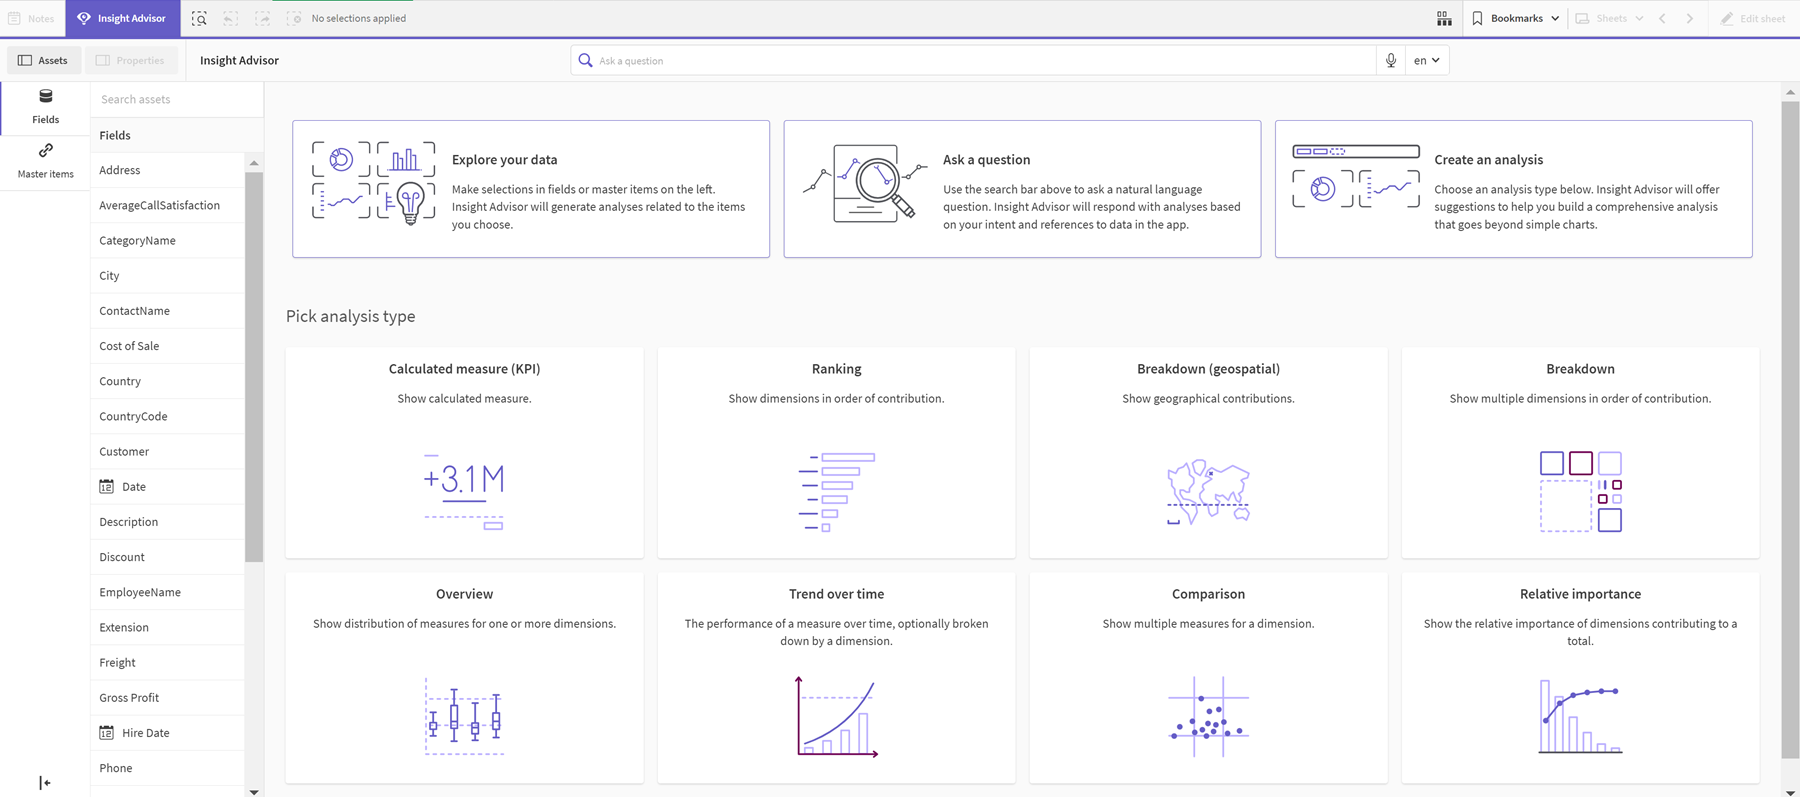
Go to Sheet in the app navigation menu and click Insight Advisor. Look at the Assets panel. There is a significantly reduced number of fields in Assets. The ID fields are no longer there, for example.
Fields in Insight Advisor assets panel

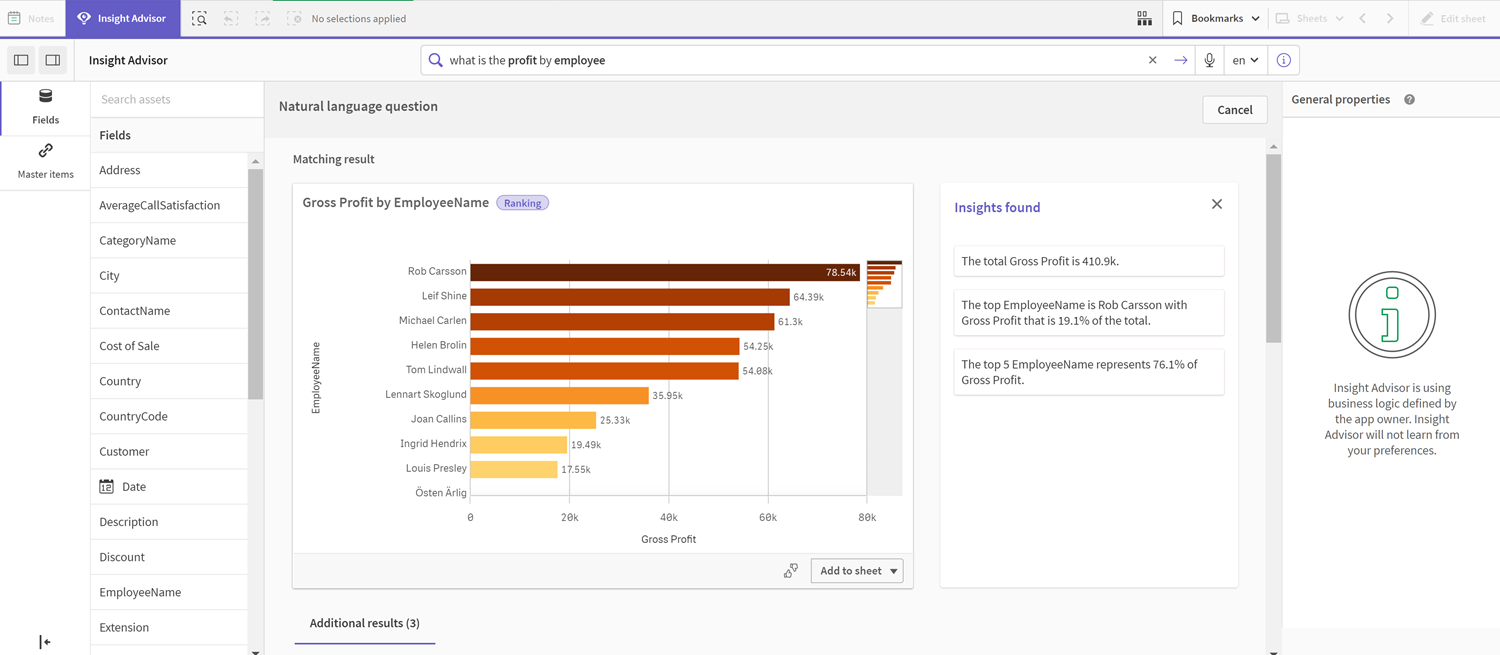
Now, search for what is the profit by employee. This time, instead of EmployeeID, Insight Advisor uses EmployeeName, a more useful field to use as a dimension in visualizations.
Results for what is the profit by employee

