Reviewing your hierarchies
Next, you will review the hierarchies in your logical model. Hierarchies is an optional business logic feature. It defines drill-down relationships between groups.
When you enable business logic, some hierarchies may be automatically created by Qlik Sense from your data model. If you navigate to Hierarchies, you can see that business logic has created two hierarchies.
Hierarchies in the logical model

Hierarchies indicate groups that can be used to break each other down in analysis. For example, the two hierarchies created by Qlik Sense correctly identify two drill-down relationships in our logical model:
-
The data in the Category fields can be broken down into the data in the Products fields.
-
The data in the Suppliers fields can be broken down into the data in the Products fields.
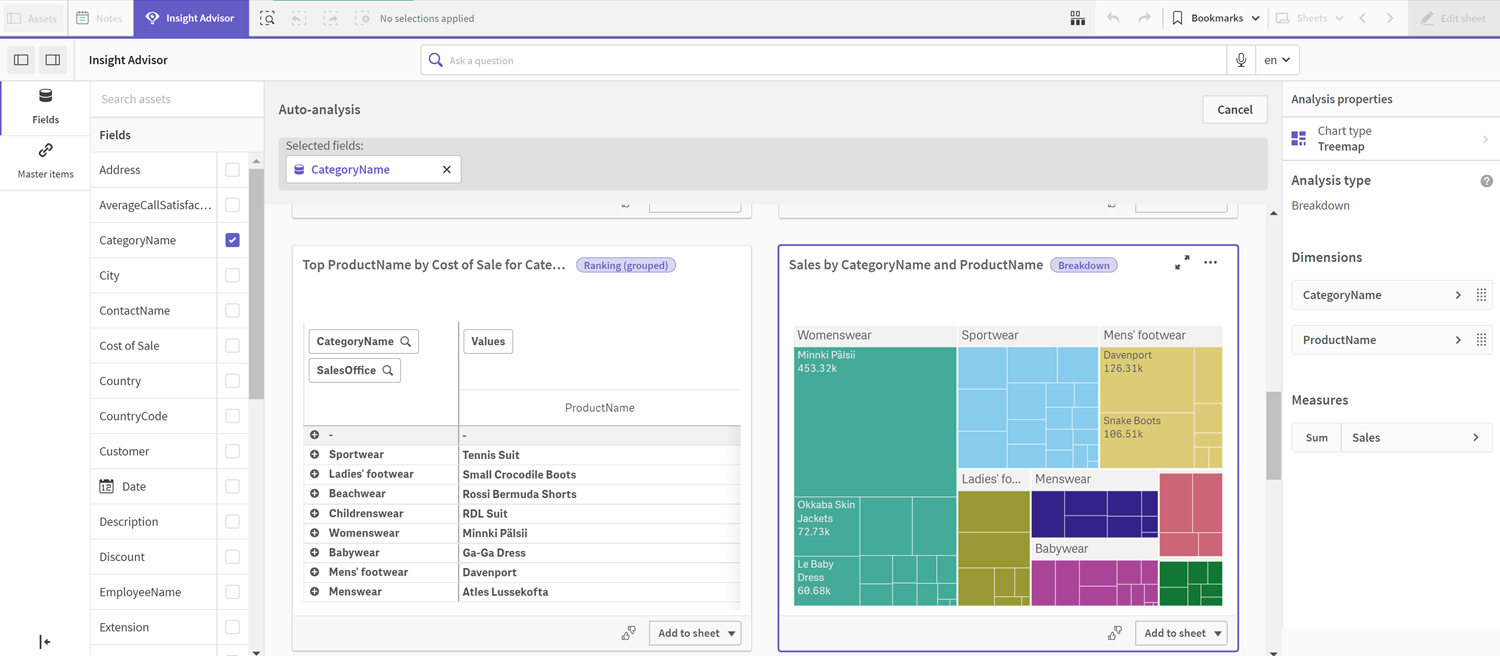
If you navigate to Sheet, click Insight Advisor, and select CategoryName, Insight Advisor includes a treemap that breaks down CategoryName by ProductName.
Category and products breakdown

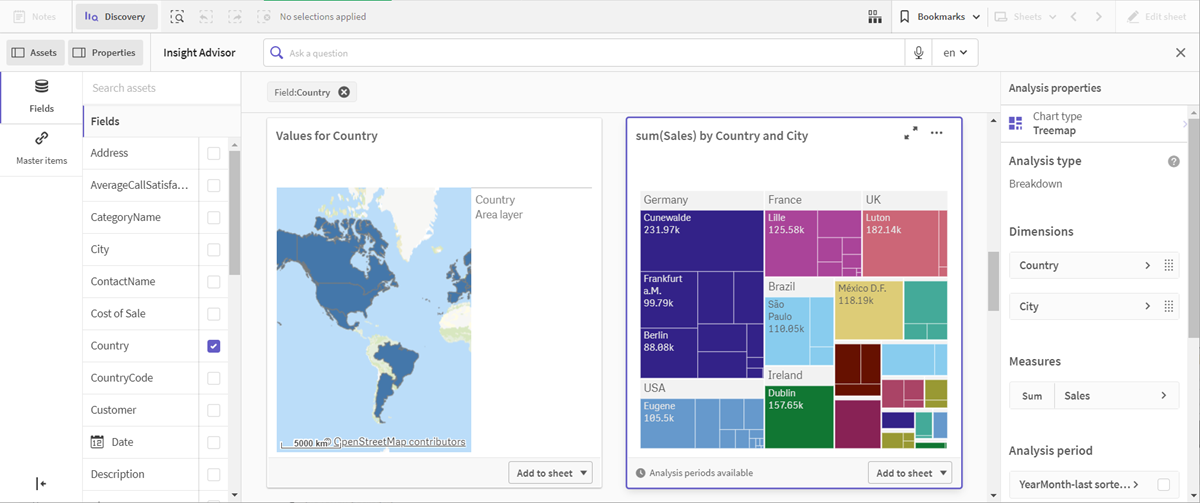
In addition to defined hierarchies, the logical model can contain learned hierarchies. These are learned automatically from how fields are used and defined in the data model. For example, navigate to Sheet and click Insight Advisor. From the assets panel, select Country. You now have results that reflect a City-Country hierarchy, including a treemap that shows sum(Sales) by Country and City. This hierarchy is a learned hierarchy detected from the data model.
New Insight Advisor results for Country

