Early Access: The content on this website is provided for informational purposes only in connection with pre-General Availability Qlik Products.
All content is subject to change and is provided without warranty.
Skip to main content Skip to complementary content

Org chart

You can use the org chart (Org chart) to create organization charts from data with a tree structure. You can navigate through the hierarchy by expanding and collapsing the tree. The org chart is included in the Visualization bundle.

You need to use a data set with two dimensions that define the tree structure.

  • The first dimension needs to be the ID of the node. This would typically be an employee ID in a traditional organization chart.
  • The second dimension needs to be the ID of the parent node. This would typically be the employee ID of a manager.

    This connects to the first dimension to create a tree structure.

    If this value is empty or points to a node that does not exist, the node becomes a root node at the top of the tree.

Example data set for an org chart
EmployeeID ManagerID Name Title
A101   Mary Bell CEO
A102 A101 John Bialik Executive secretary
O101 A101 Lee Mayer COO
I101 A101 Wendy Sanderson CIO
T101 A101 Asim Nawrat CTO
T102 T101 Emily Diaz VP Products
T103 T101 Christine Nemic VP R & D

You can also add a measure that is used as a card description.
Preparing the dataset

There are some things you need to consider when preparing the dataset for an org chart.

  • You need to use a dataset with less than 33000 rows.

    If you use a larger dataset, the excess rows will be ignored. This can result in a tree with incorrect structure. A message is displayed: The maximum data limit is reached. The tree may display incorrectly.

  • Make sure that the data does not contain circular references.

    Circular references can result in nodes being omitted, or creation of multiple root nodes. One of these messages is displayed:

    Data contains circular references, nodes are omitted.

    No root node, check your data for circular references.

  • If a node has more than 99 children, the excess children nodes will not be rendered.

    A message is displayed: Maximum number of child nodes reached, nodes are omitted.

  • You should avoid having a large number of rows that do not have a parent node. These will be shown as root nodes. The maximum number of root nodes is 99.

Creating an org chart

You can visualize the example data set using an org chart. Every employee is shown as a card in a tree structure that you can expand and collapse.

  1. Turn on Advanced options.
  2. Add an Org chart to your sheet.
  3. Set the first dimension to be EmployeeID.
  4. Set the second dimension to be ManagerID.
  5. Add labels to the cards. Expand the EmployeeID dimension to see the label properties.

    1. Set Card title to Name.
    2. Set Card sub-title to Title.

Org chart with cards and titles.

Changing the appearance of the chart

You can customize the appearance of your org chart.

Adding a measure to set a description

You can display a description by adding a measure. This will replace the value set in the property Card description.

Changing the presentation mode

You can set how the org chart displays in AppearancePresentationPresentation mode. Org charts can either display the entire tree, or they can collapse and expand. If an org chart is set to Expand/collapse, you can also set the org chat to automatically resize to fit every time it is expanded or collapsed.

Changing the colors

You can change the color of the card background in two different ways:

  • Expand the first dimension and set an expression that returns a color or a color code under Card background color. You can refer to data fields in the expression.
  • Set a background color under Appearance > Presentation > Background color. You can set all cards to a single color, or use an expression. If you use an expression you cannot refer to data fields.

You can also set the color of the text with Appearance > Presentation > Font color.

Changing card borders

You can choose if org chart cards have borders and top bars under Card appearance. If you choose to include borders, you can set a border color in Appearance > Presentation > Border color. You can set borders to a single color or use an expression. If you use an expression, you cannot refer to data fields.

Selections in the org chart

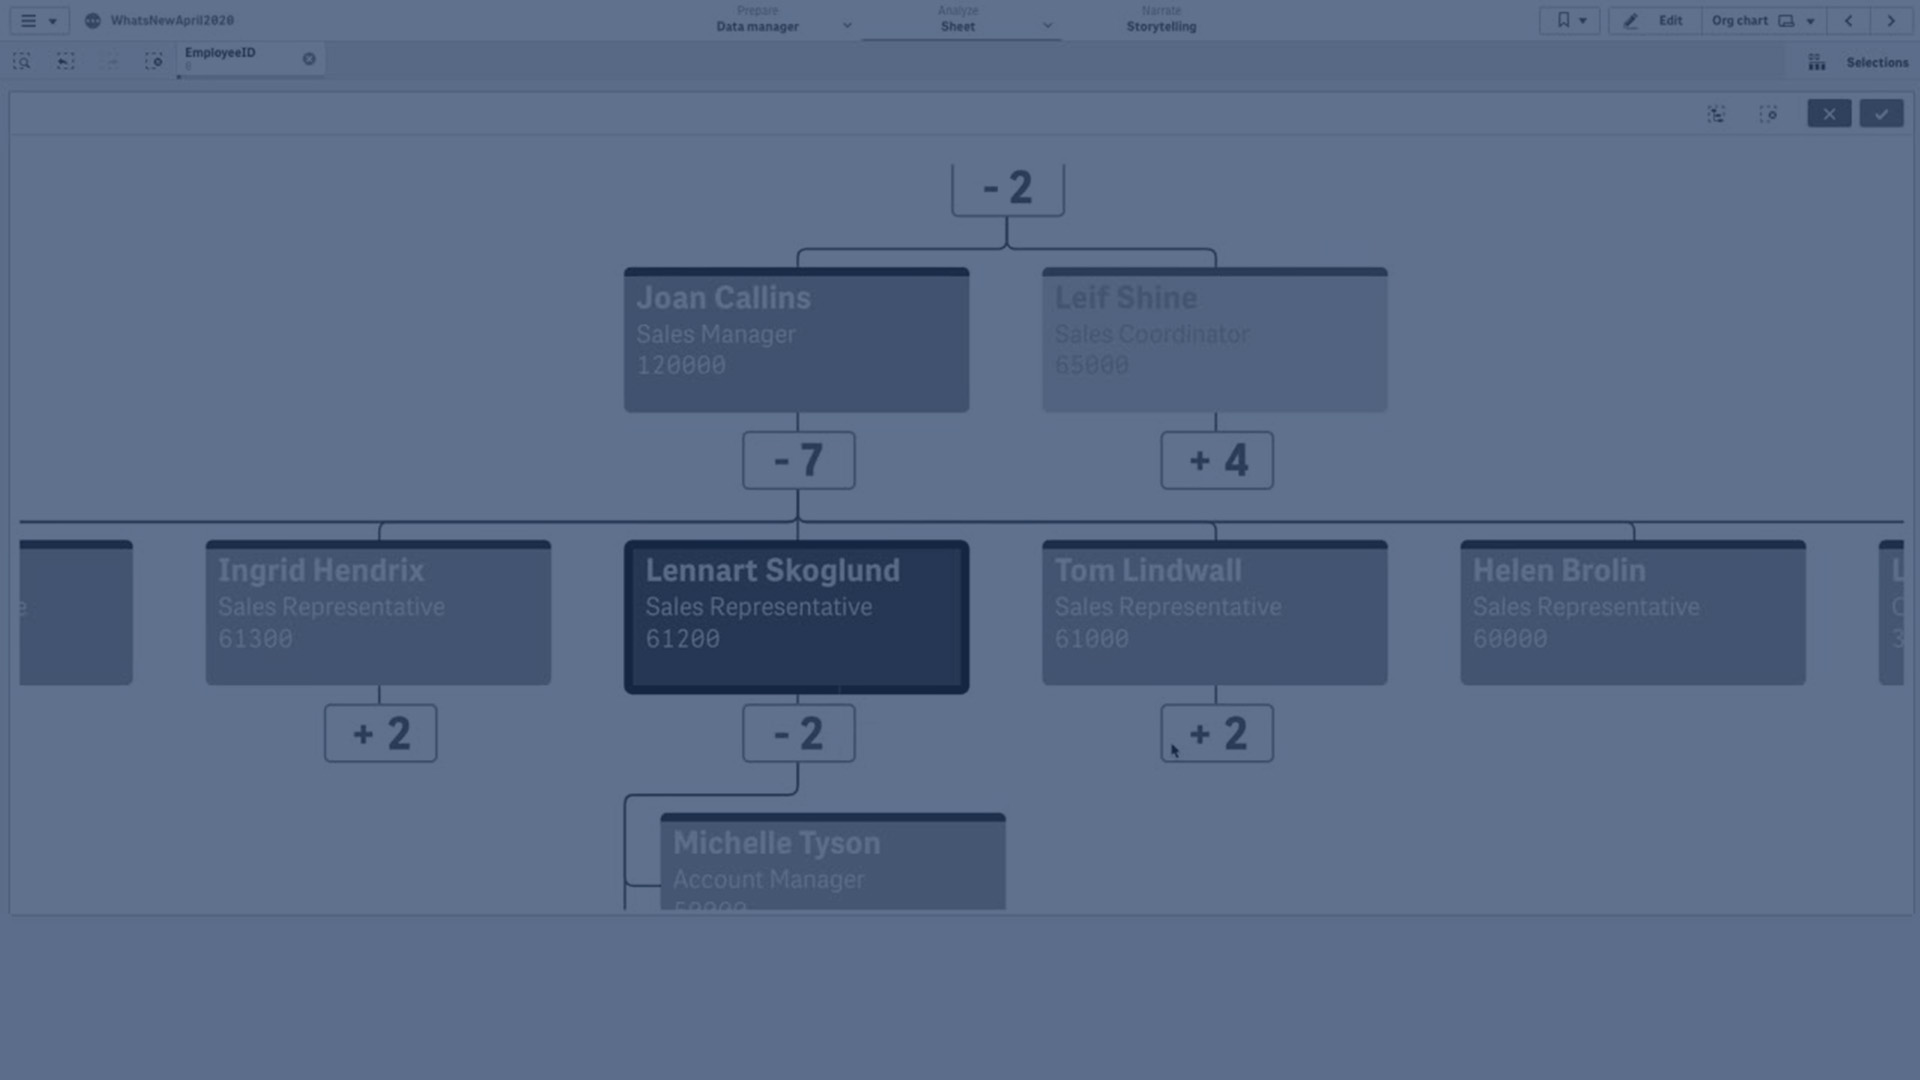
You can select cards in the org chart. Selecting a card will include all child nodes below a card in the selection.

Limitations

For information about general limitations, see Limitations.

Learn more

Did this page help you?

If you find any issues with this page or its content – a typo, a missing step, or a technical error – let us know how we can improve!